
#30DayMapChallenge: OpenStreetMap
From glowing pedestrian networks to 3D cityscapes, the "OpenStreetMap" once again proved that a collaborative dataset can inspire stunning cartographic diversity.
The "Data: OpenStreetMap" prompt for the #30DayMapChallenge is always a highlight. It's a testament to the power of this collaborative, global project, showing how a single, open dataset can be a springboard for incredible diversity in style, technique, and narrative. Here are five distinct approaches that caught my eye.
5. Courtney Yatteau: The skeletal glow of walkable cities
Courtney extracted the walkable cores of Washington DC, Amsterdam, Tokyo, and London using OSM data for footways and pedestrian streets. She layered these networks over a dark basemap, making them glow like luminous street skeletons. This minimalist approach brilliantly contrasts the unique feel of each city's pedestrian infrastructure, using Esri and Leaflet to create a striking comparative visual.
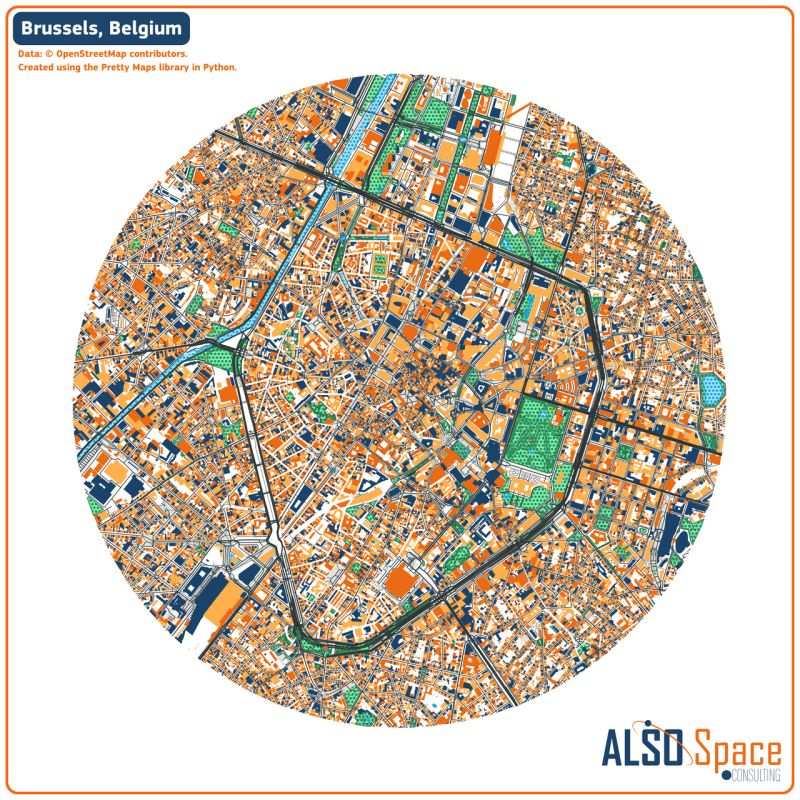
4. ALSO Space: The artistic complexity of Brussels
The team at ALSO Space used the Pretty Maps Python library to transform raw OSM data of central Brussels into a work of art. The library applies a cohesive colour palette and stylistic rules, simplifying the city's complexity into an engaging visual. This map perfectly illustrates their mission to turn geospatial data into clear and genuinely beautiful visualisation.
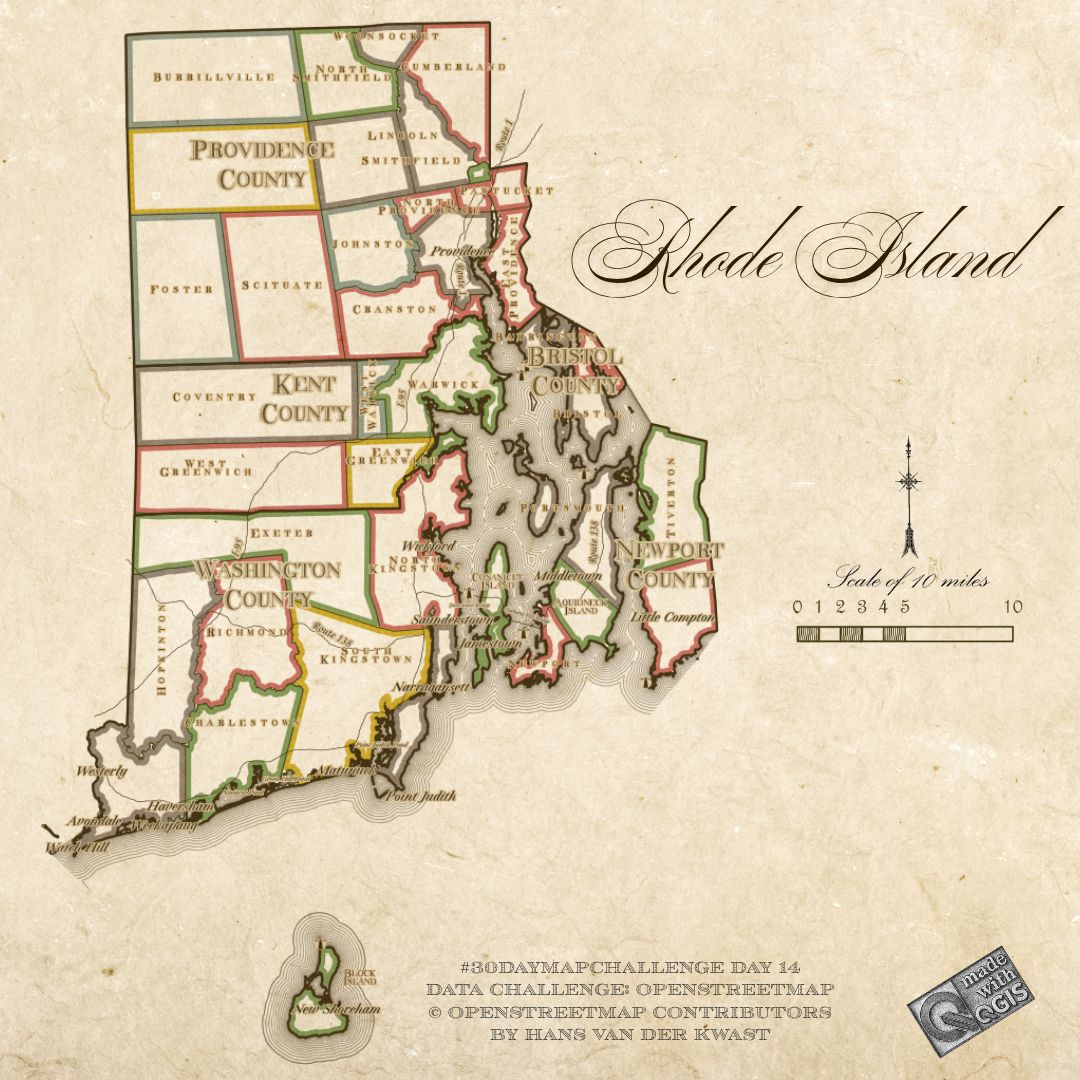
3. Hans van der Kwast: A vintage makeover for Rhode Island
Hans gave modern OSM data a 19th-century aesthetic using a sophisticated QGIS workflow. He used raster image fills and geometry generators to replicate the colours and textures of historical maps. The result is a fascinating anachronism—a completely up-to-date map of Rhode Island that carries the warmth and charm of a vintage chart, showcasing the power of creative styling.
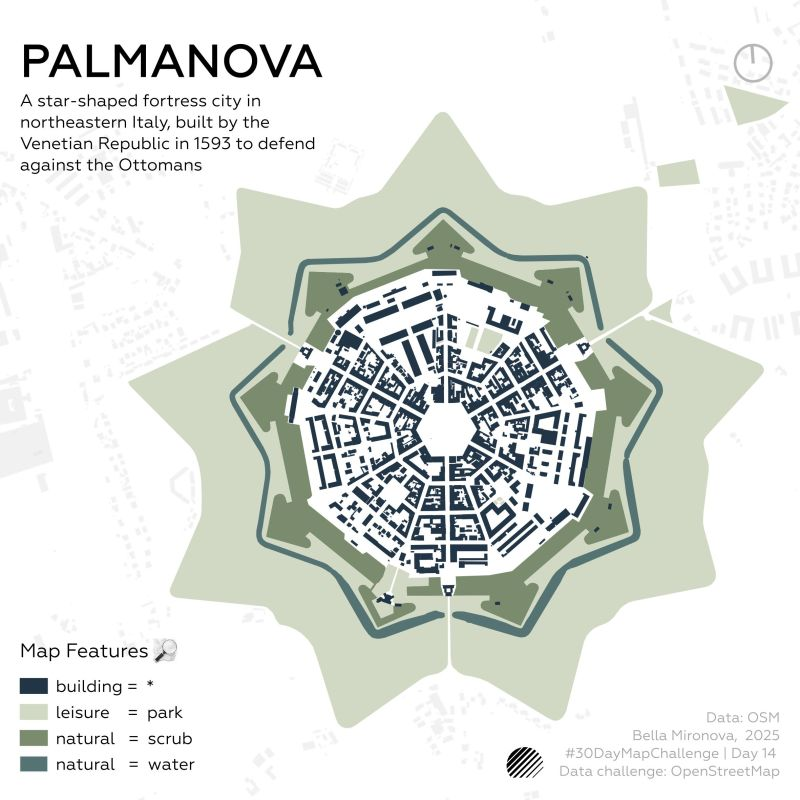
2. Bella Mironova: The perfect geometry of Palmanova
Bella focused on the star-shaped fortress city of Palmanova, Italy, using a elegantly simple approach. Her map demonstrates how the city's well-preserved 16th-century structure can be revealed using just four OSM tags. This is a powerful lesson in the semantic structure of OpenStreetMap, proving that a deep understanding of its tagging system can isolate historical features with remarkable clarity.
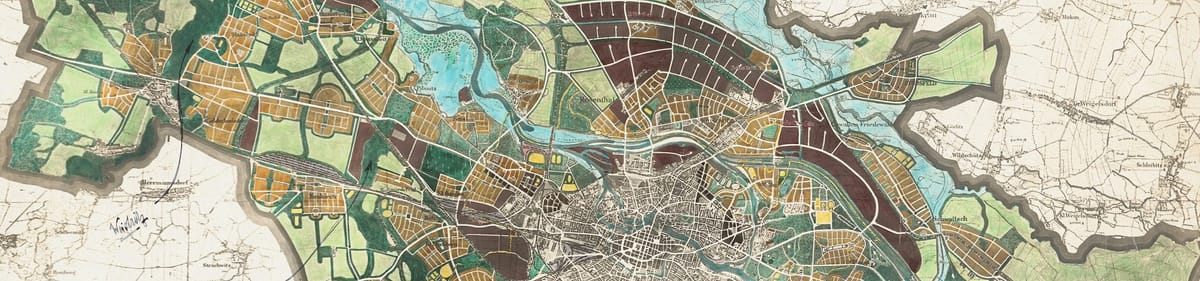
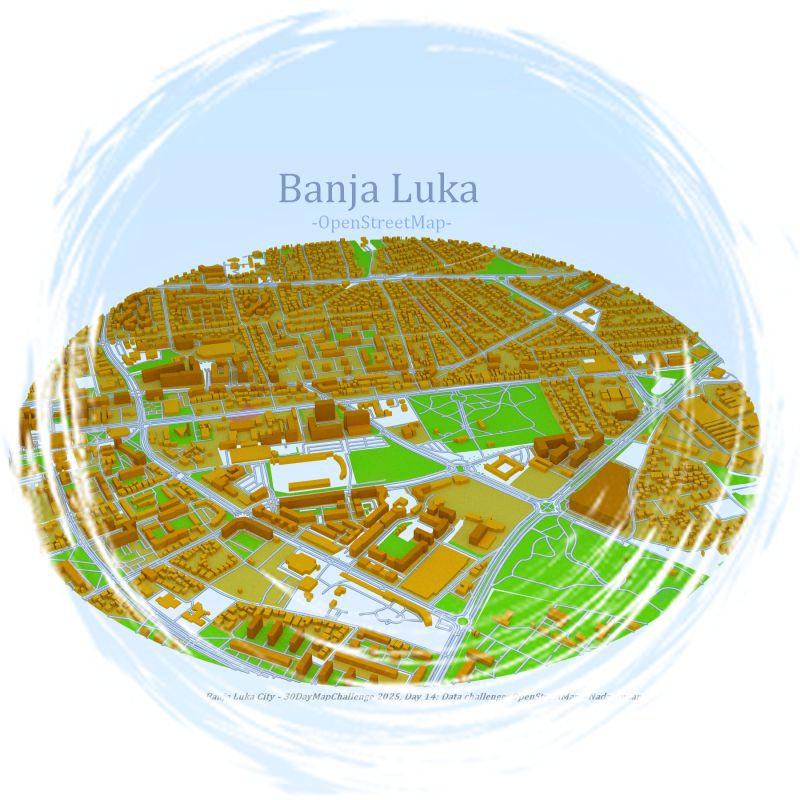
1. Nada Rudan: The 3D urban landscape of Banja Luka
Nada created a stunning 3D visualisation of Banja Luka City using R and the rayrender package. By extruding OSM building data, she gave the city volume, using lighting and shadow to create a dramatic, tangible landscape. This approach makes geospatial data intuitively understandable and showcases how accessible tutorials empower new cartographers to create professional-level visualisations.
What unites all these maps is their foundation: the rich, collaborative, and open data provided by OpenStreetMap. From a star-shaped fortress to a glowing pedestrian network, it's the canvas upon which these cartographic artists paint. The creativity on display is a perfect reminder of why this challenge continues to inspire.


Comments ()