
#30DayMapChallenge: A new tool
Day 17 showcased how new tools are expanding cartographic possibilities.

For Day 17 of the #30DayMapChallenge, cartographers were tasked with stepping outside their comfort zones to experiment with a new software, library, or technique. The results were a fascinating showcase of how fresh tools can unlock new perspectives, from AI-powered analysis to hand-painted aesthetics and browser-based data processing.
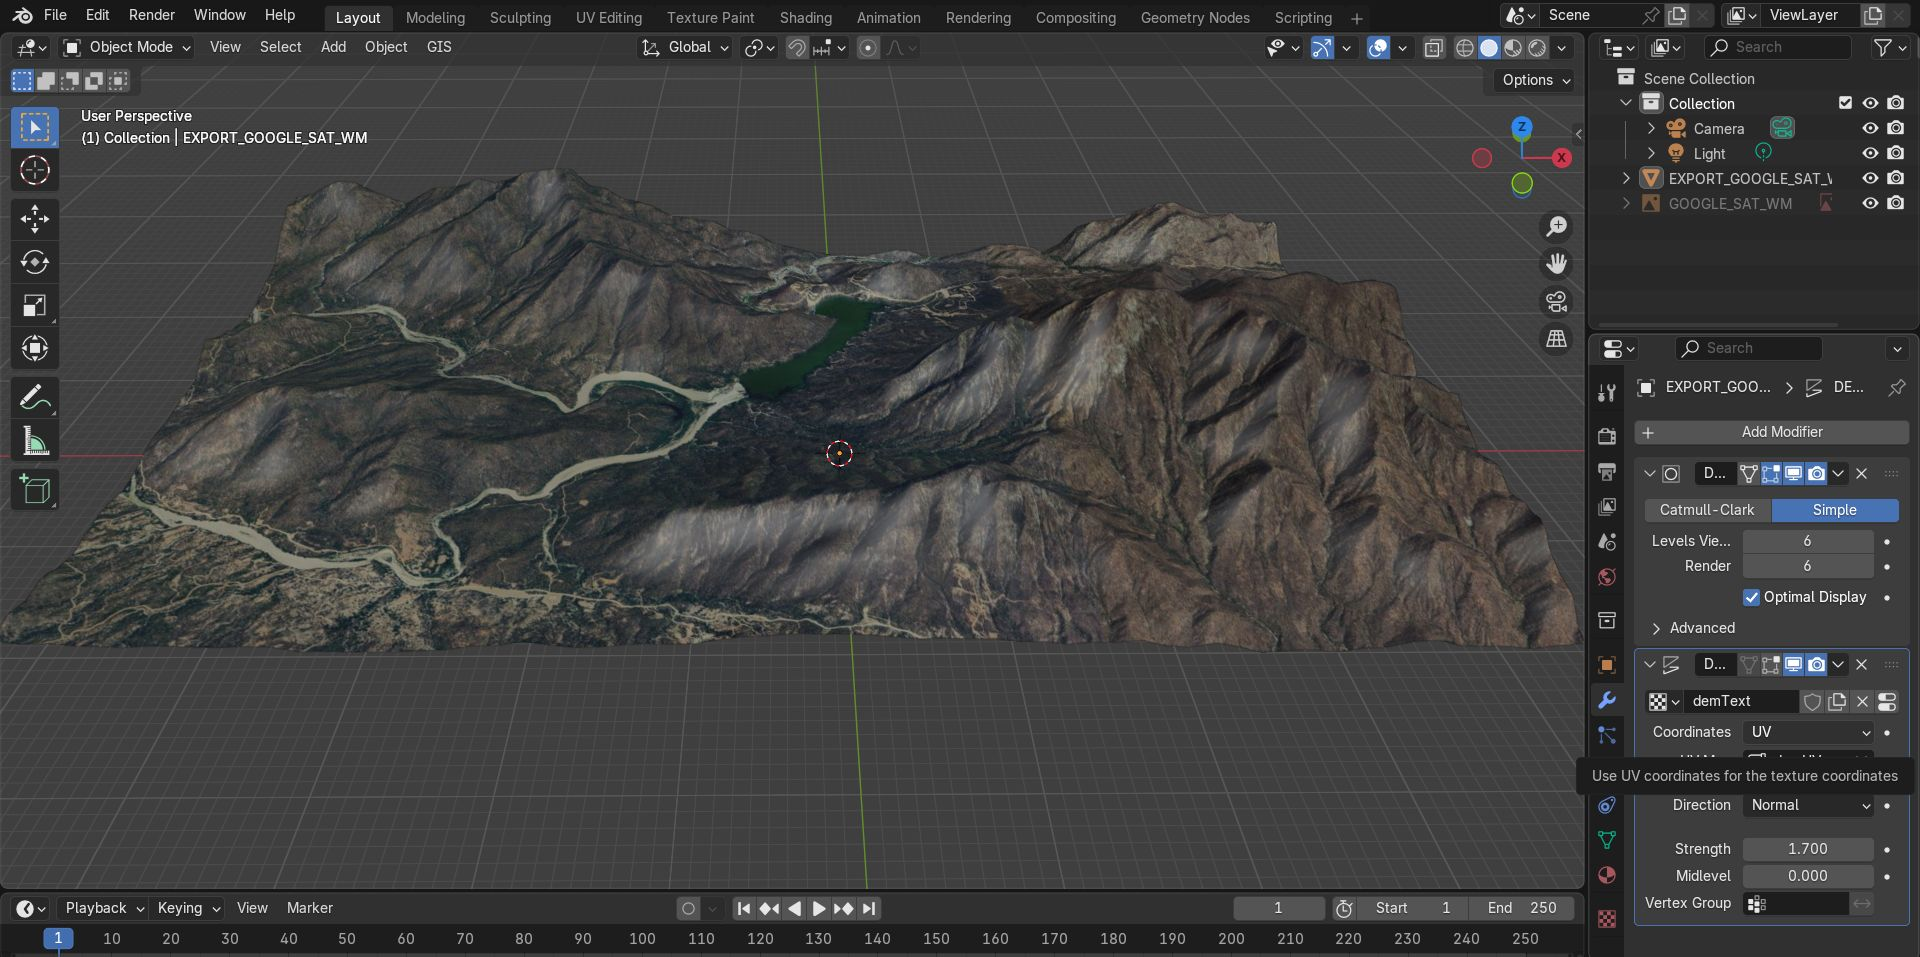
5. Kornika Bhattacharya – Discovering 3D with BlenderGIS
Kornika Bhattacharya, already proficient with ESRI and QGIS, ventured into the world of 3D by learning BlenderGIS. She used the add-on to transform Google Satellite imagery of the Presa area in California into a compelling three-dimensional landscape. Her work-in-progress highlights the powerful, cinematic potential of Blender for cartographic visualisation, proving that the learning journey in geospatial technology is ageless and full of creative possibility.
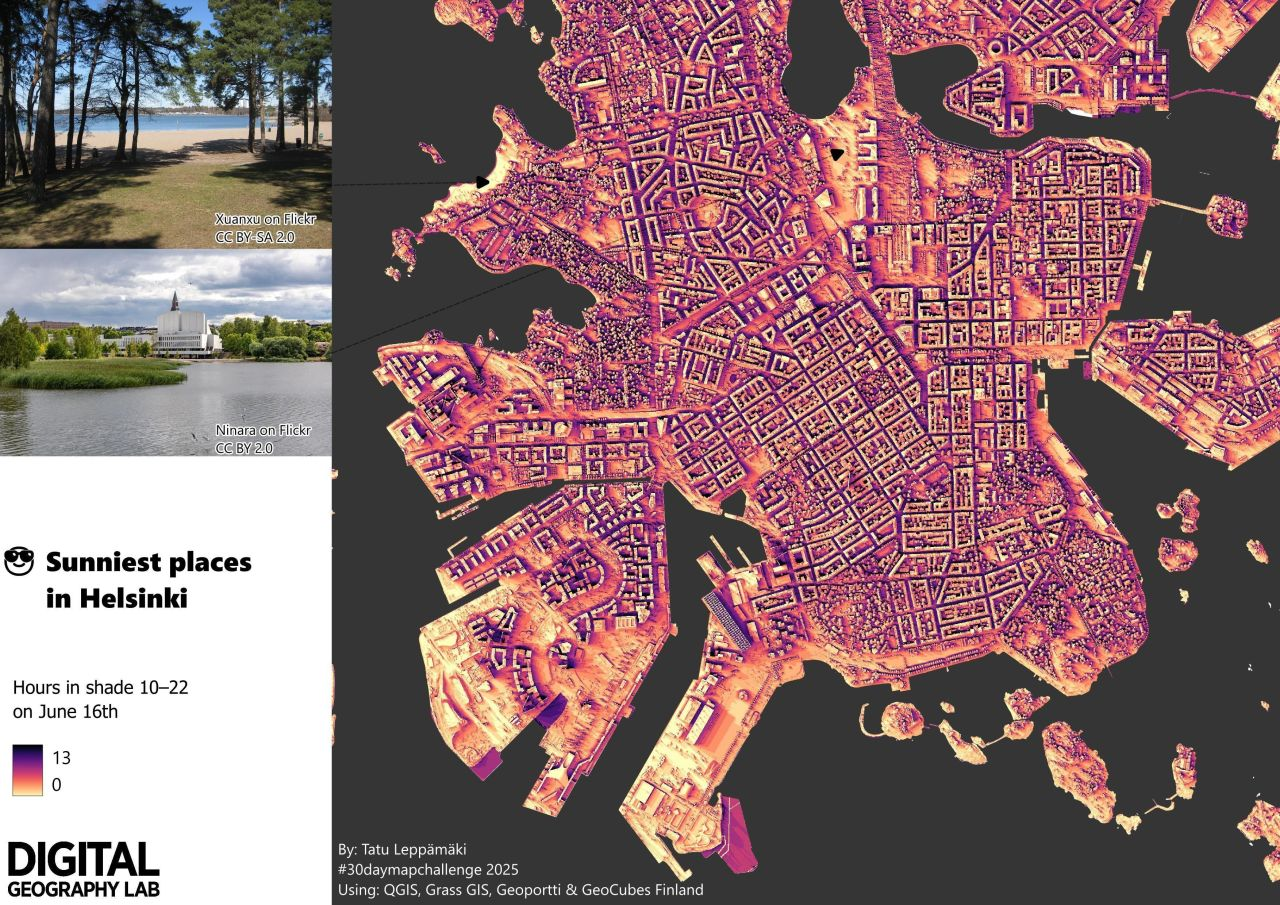
4. Digital Geography Lab – Modelling sunlight with GRASS GIS
The Digital Geography Lab tackled Helsinki's notoriously dark November by remembering the summer sun. Using the solar irradiance model in GRASS GIS—a new tool for them—they mapped the city's sunniest and shadiest places in June. Beyond the static analysis, they built an interactive web map, allowing the public to play with shade data and transforming a complex geocomputation into an engaging public-facing tool.
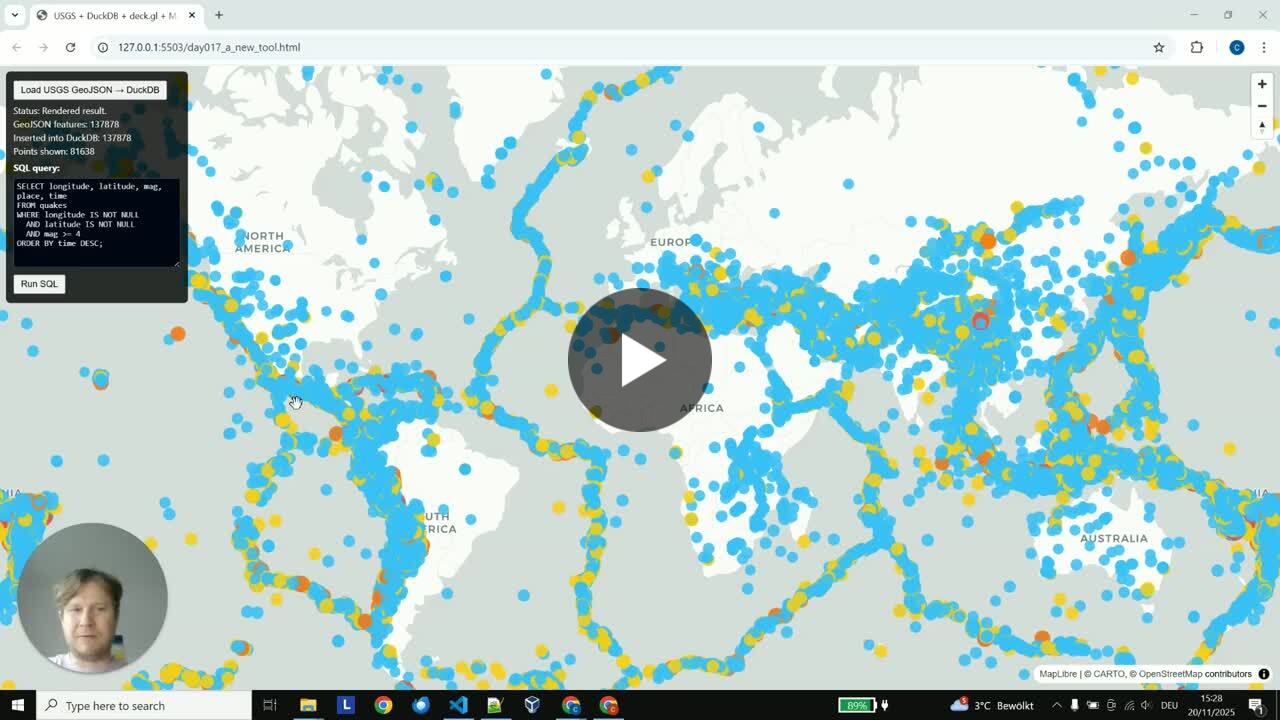
3. Christian Lutz – Bringing a database to the browser with DuckDB
Christian Lutz demonstrated a significant shift in web mapping architecture by loading over 137,000 earthquake records directly into a web browser using DuckDB-WASM. This approach eliminates the need for a backend server, allowing for instant SQL queries and filtering on massive datasets. The result, visualised with MapLibre and Deck.GL, is a blazing-fast application that keeps data local and opens new doors for efficient, client-side spatial analysis.
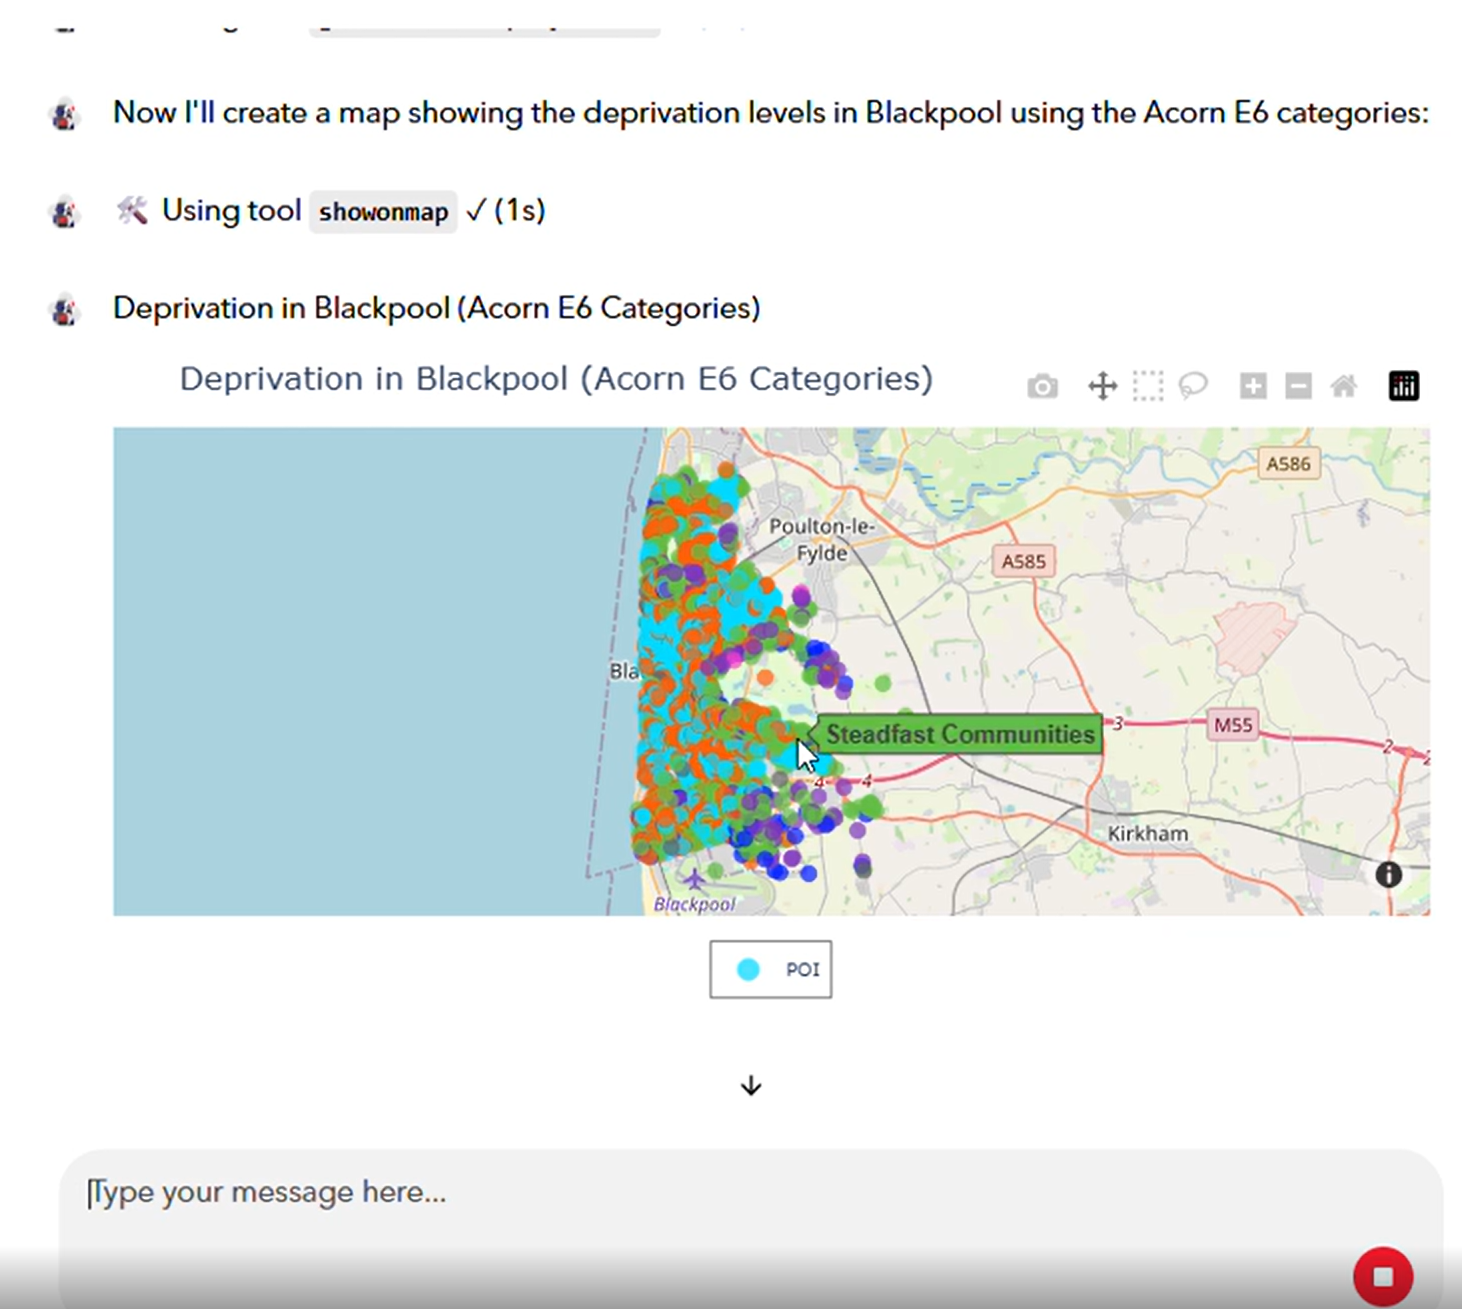
2. Kevin Gilholm – Mapping with an AI agent
Kevin Gilholm embraced the most abstract of new tools: an internal, agentic Intelligence Platform. Using plain natural language, he tasked the AI with producing a map of deprivation in Blackpool, drawing on internal datasets. The system generated a fully rendered map in seconds, without a single line of code, pointing toward a future where agentic workflows make sophisticated spatial analysis instantly accessible to non-programmers.
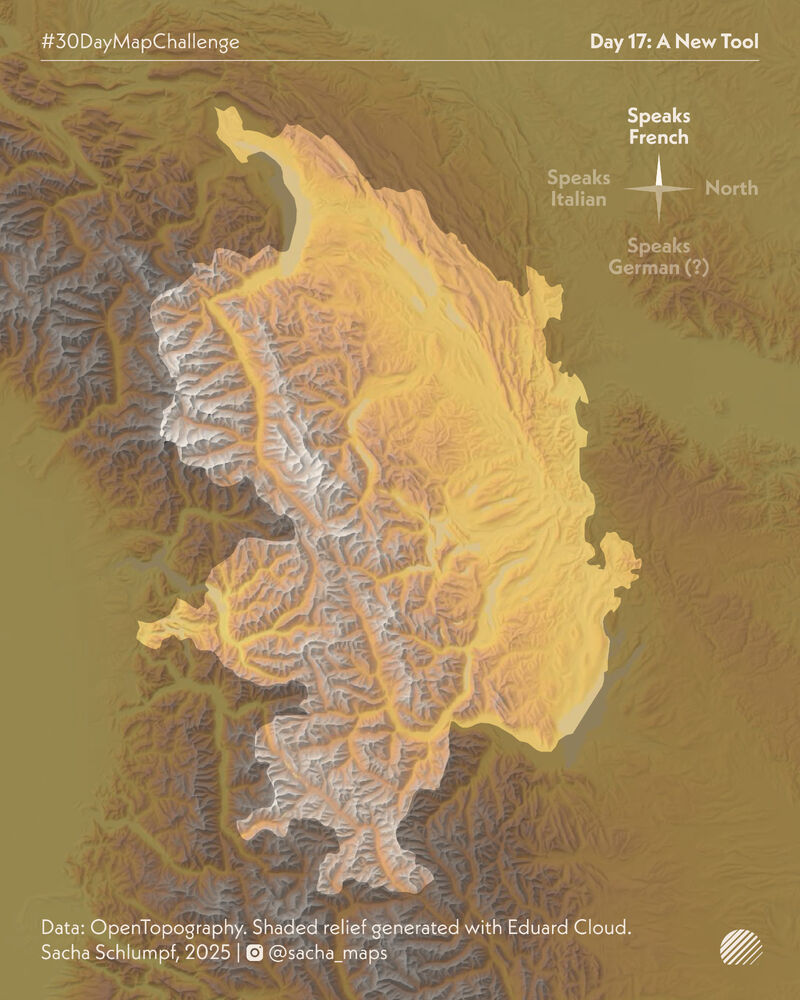
1. Sacha Schlumpf – The art of hand-drawn relief with ‘Eduard’
Topping our list is Sacha Schlumpf, who explored ‘Eduard,’ a software designed to generate shaded reliefs that mimic the hand-painted style of the legendary Swiss cartographer Eduard Imhof. The stunning result, which reorients Switzerland in a deliberately "unbiased" direction, is a masterclass in aesthetic craftsmanship. Sacha’s map is a powerful reminder that cartographic tools are not just about data, but about artistry and the conscious decisions that shape every map we see.
Together, these entries illustrate that the "new tool" is not merely a piece of software, but a key that unlocks a different way of thinking. Whether it’s processing power, artistic expression, or conversational AI, each tool expands the boundaries of what a map can be and do.


Comments ()