
#30DayMapChallenge: Accesibility
From transit time to water access, discover how mappers redefined urban accessibility on Day 7.
Day 7 maps explored how we access spaces, from public transport to waterways. Here are my top 5 picks counting down to number one:
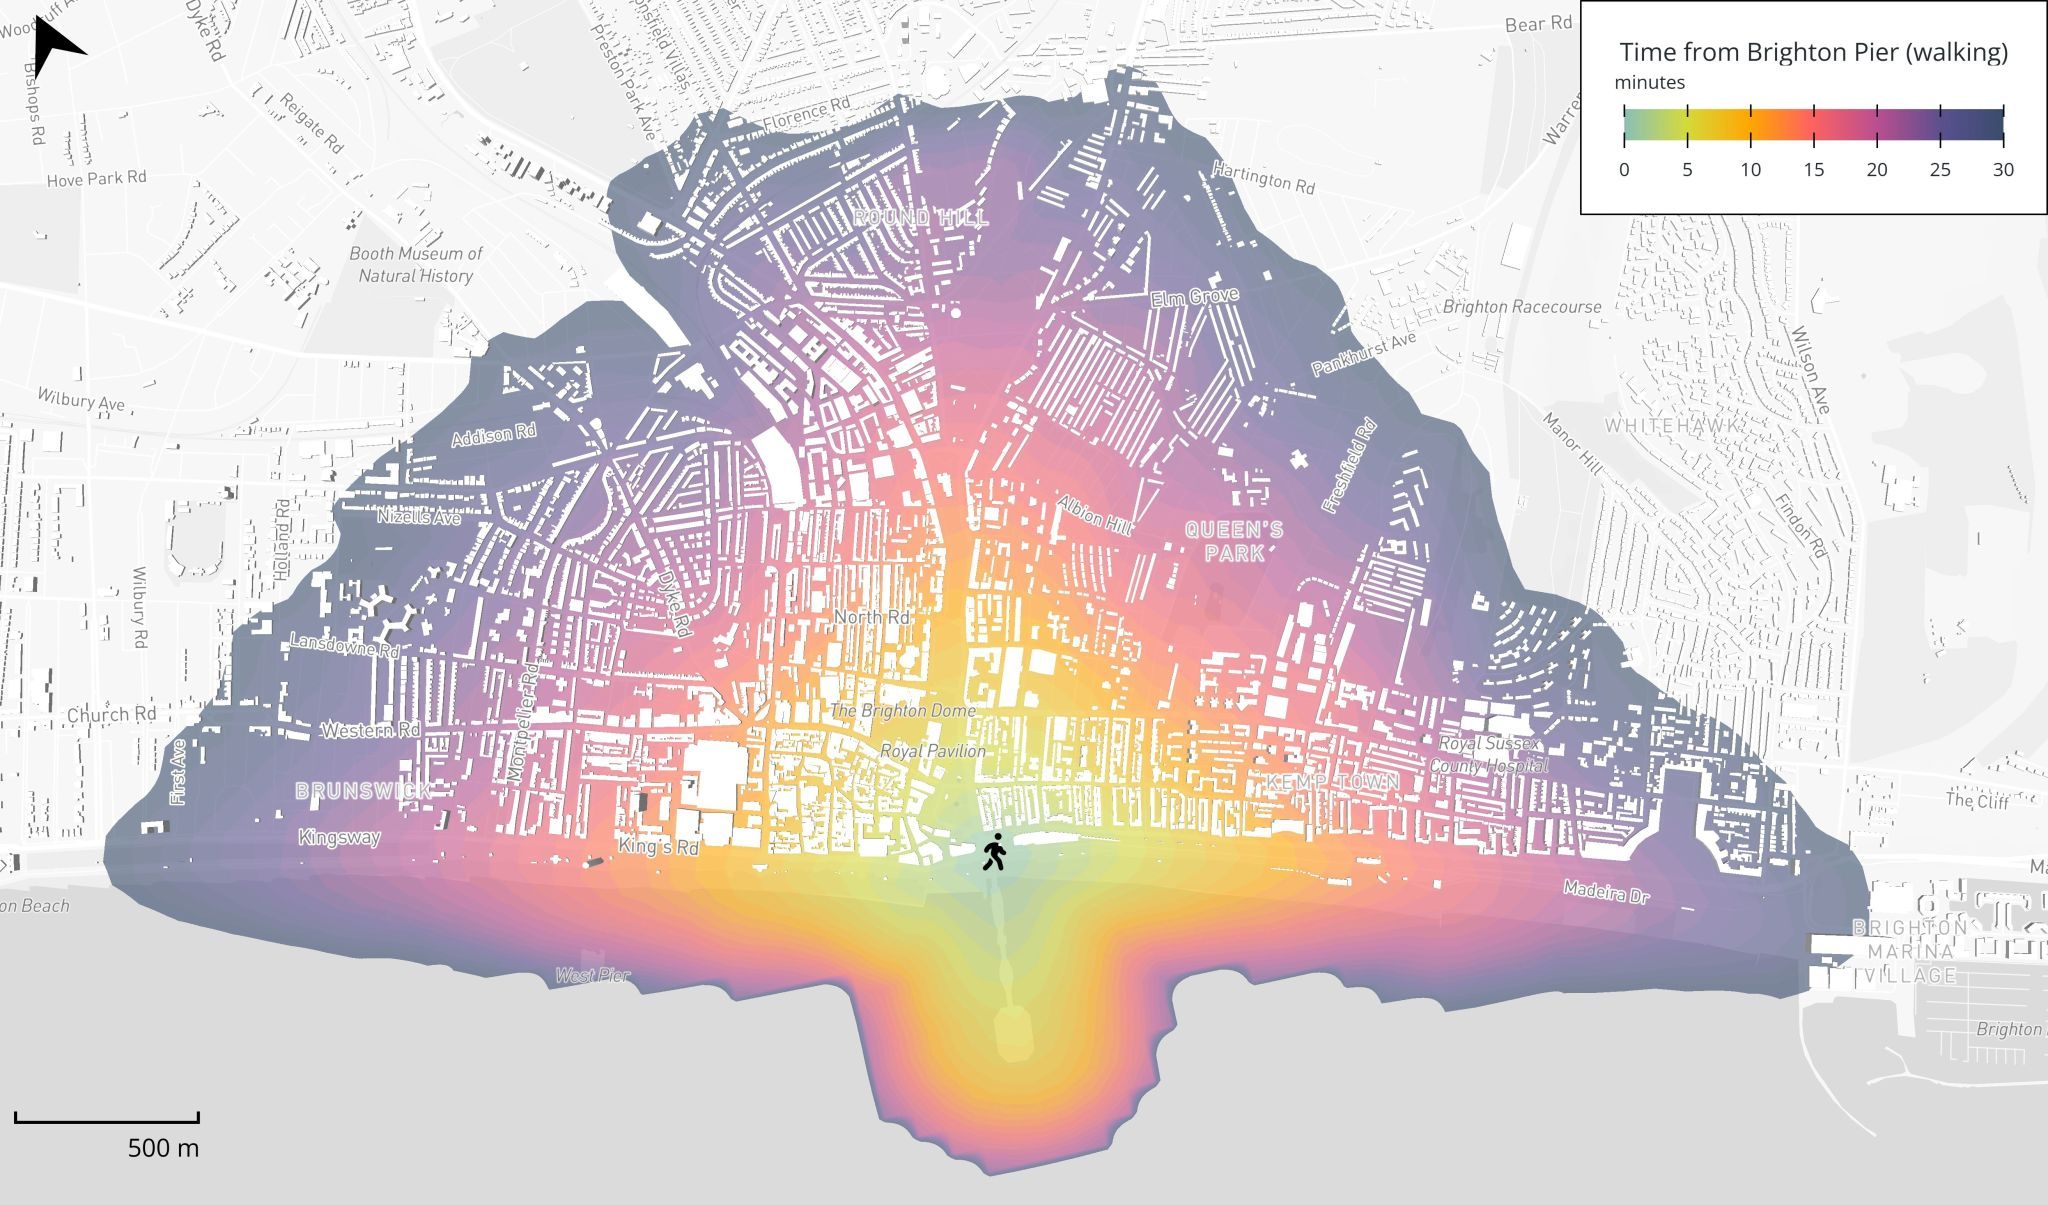
5. Thomas Baird – Brighton 30-Minute Walk
A practical isochrone map showing how far you can walk from Brighton Pier in 30 minutes, complete with 3D buildings along the route.
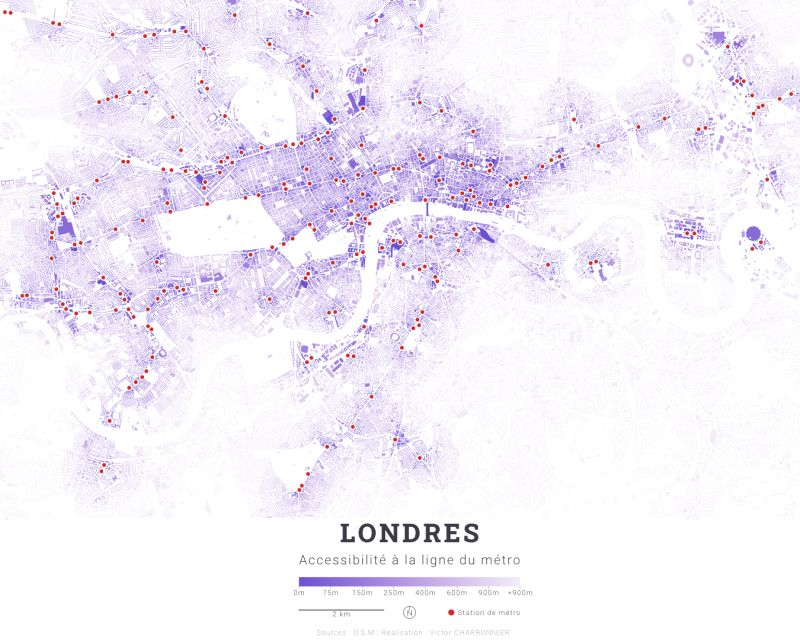
4. Victor Charbonnier – London Tube Proximity
A clean, minimalist map showing building proximity to London Underground stations - the darker the building, the closer to a station.
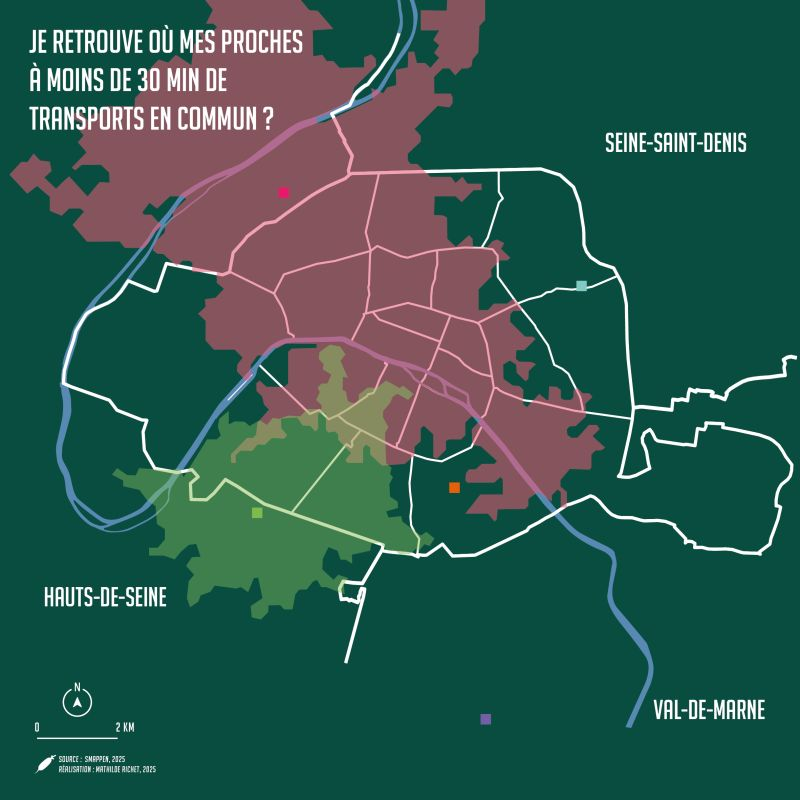
3. Mathilde Richet – Paris Meeting Points
A creative use of isochrones to find optimal meeting spots where friends from across Paris could meet within 30 minutes of transit.
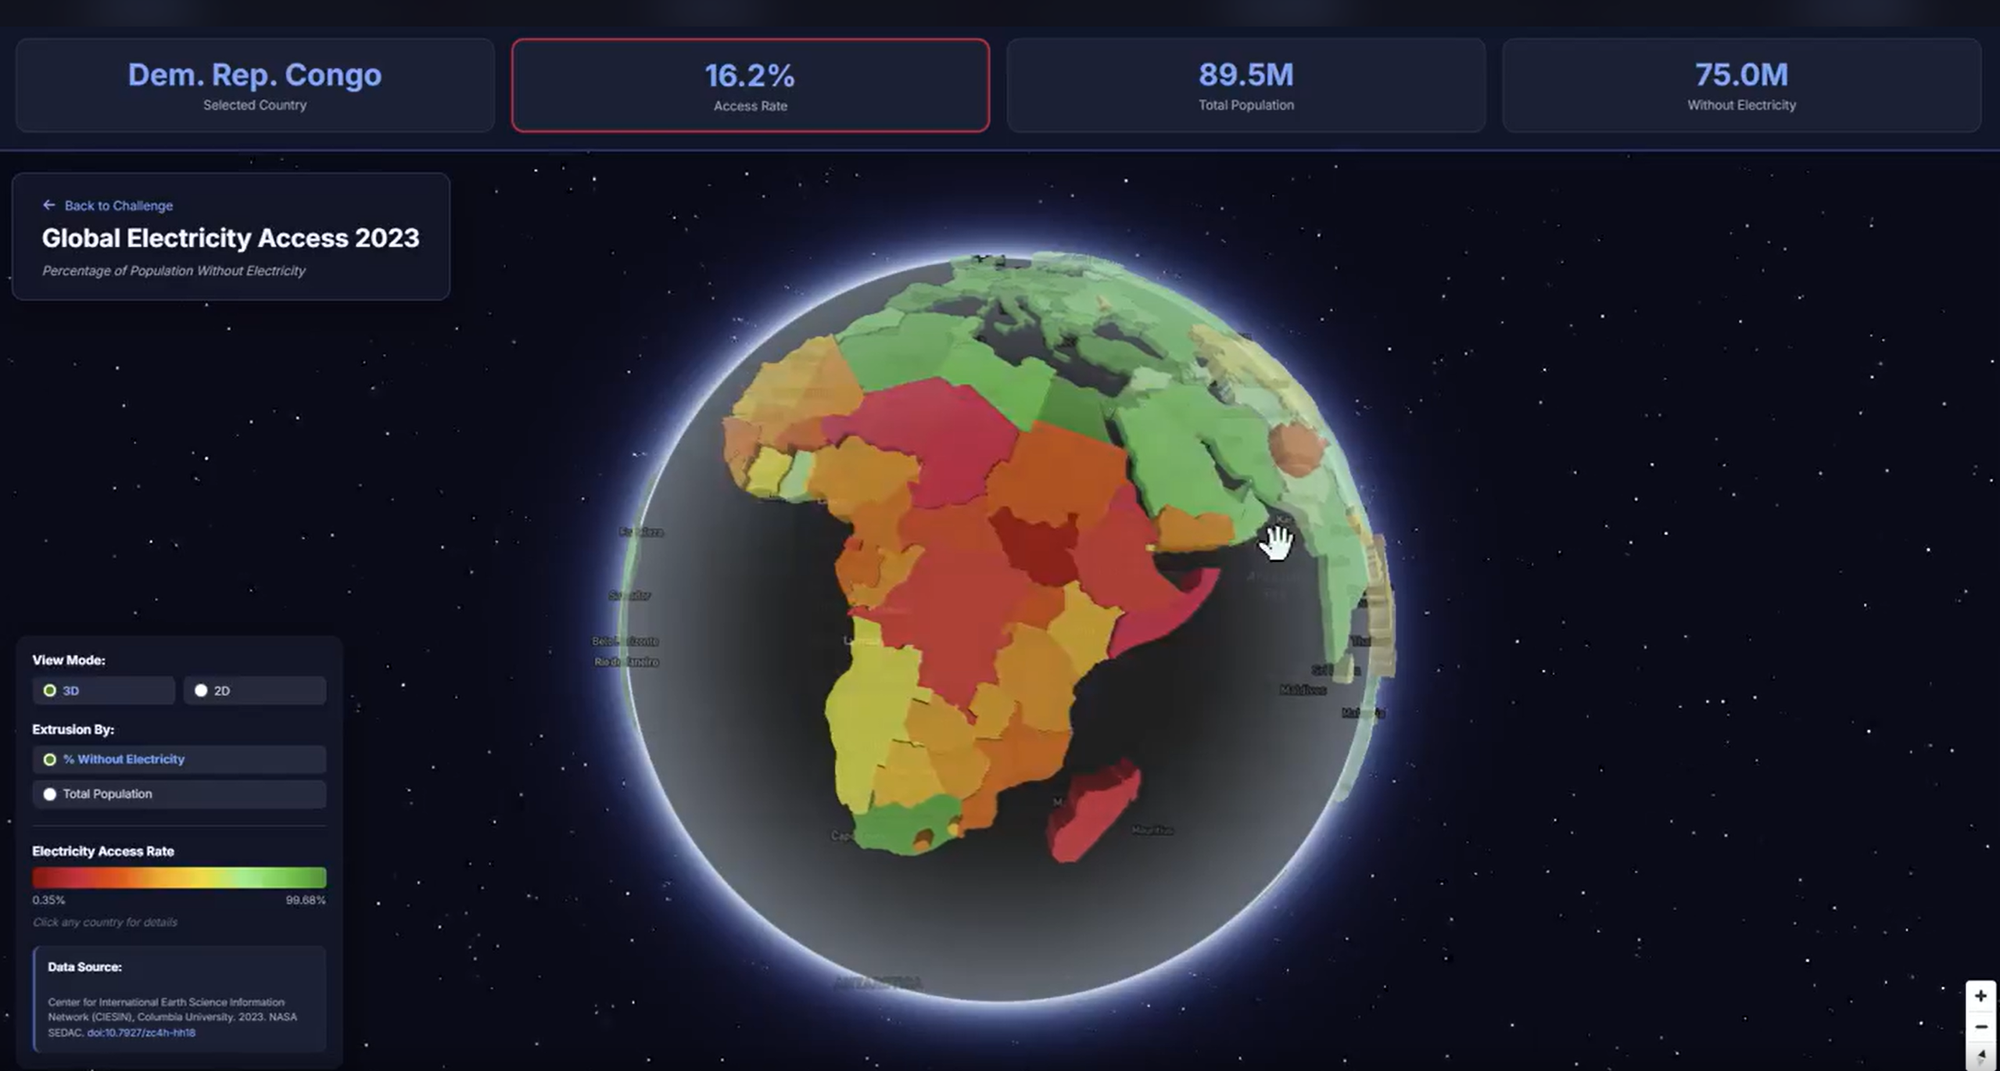
2. Mike Peckham – Global Electricity Access
A powerful data story showing both percentage and population without reliable electricity, revealing that 89.5 million people in DR Congo lack access.
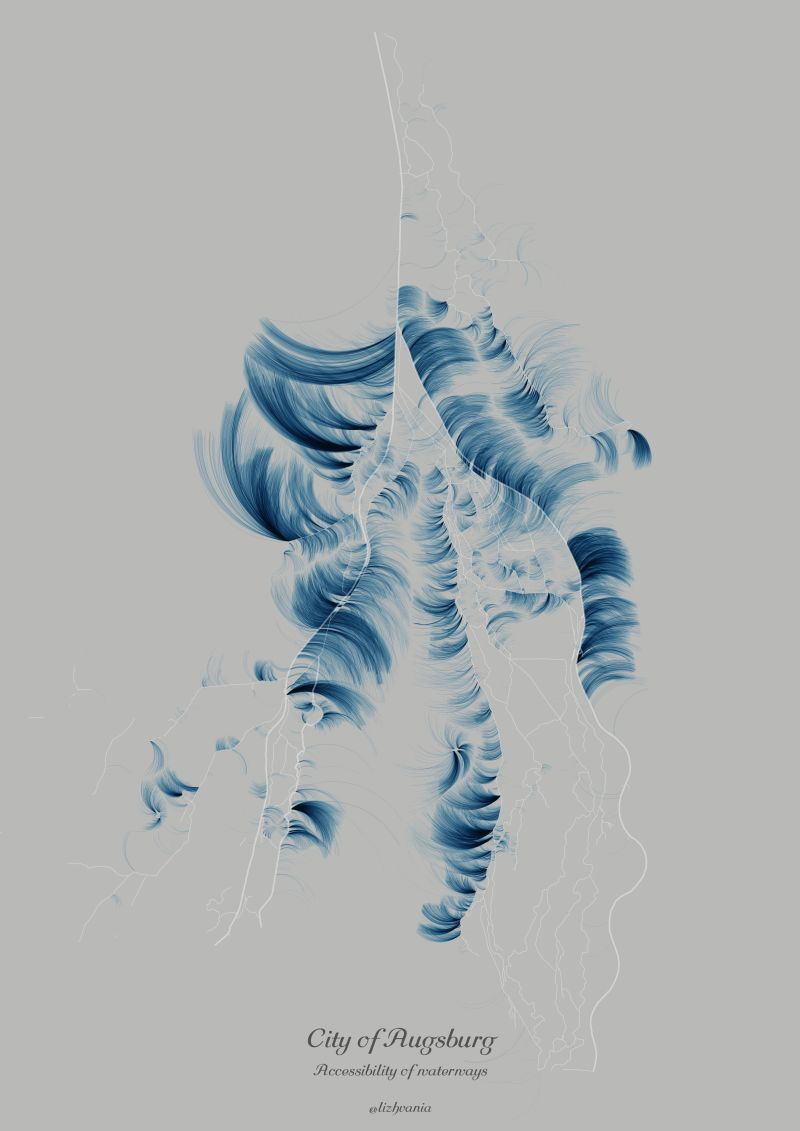
1. Lika Zhvania – Augsburg Water Access
My top pick for its unique approach - moving beyond traditional transport accessibility to show how water access shapes urban life in this UNESCO World Heritage city.
These maps show that accessibility isn't just about transport - it's about connection to resources, people, and history!
Which accessibility map changed how you think about urban spaces?


Comments ()