
#30DayMapChallenge: Cell
Day 16's "Cell" theme showcased mapping through discrete units.

In the hands of modern cartographers, the concept of a “cell” has become a lens for examining everything from biological invasions to historic castles. For Day 16, I was particularly drawn to these five visualisations, which showcase the diverse ways discrete units—be they pixels, hexagons, or radar scans—can reveal powerful patterns.
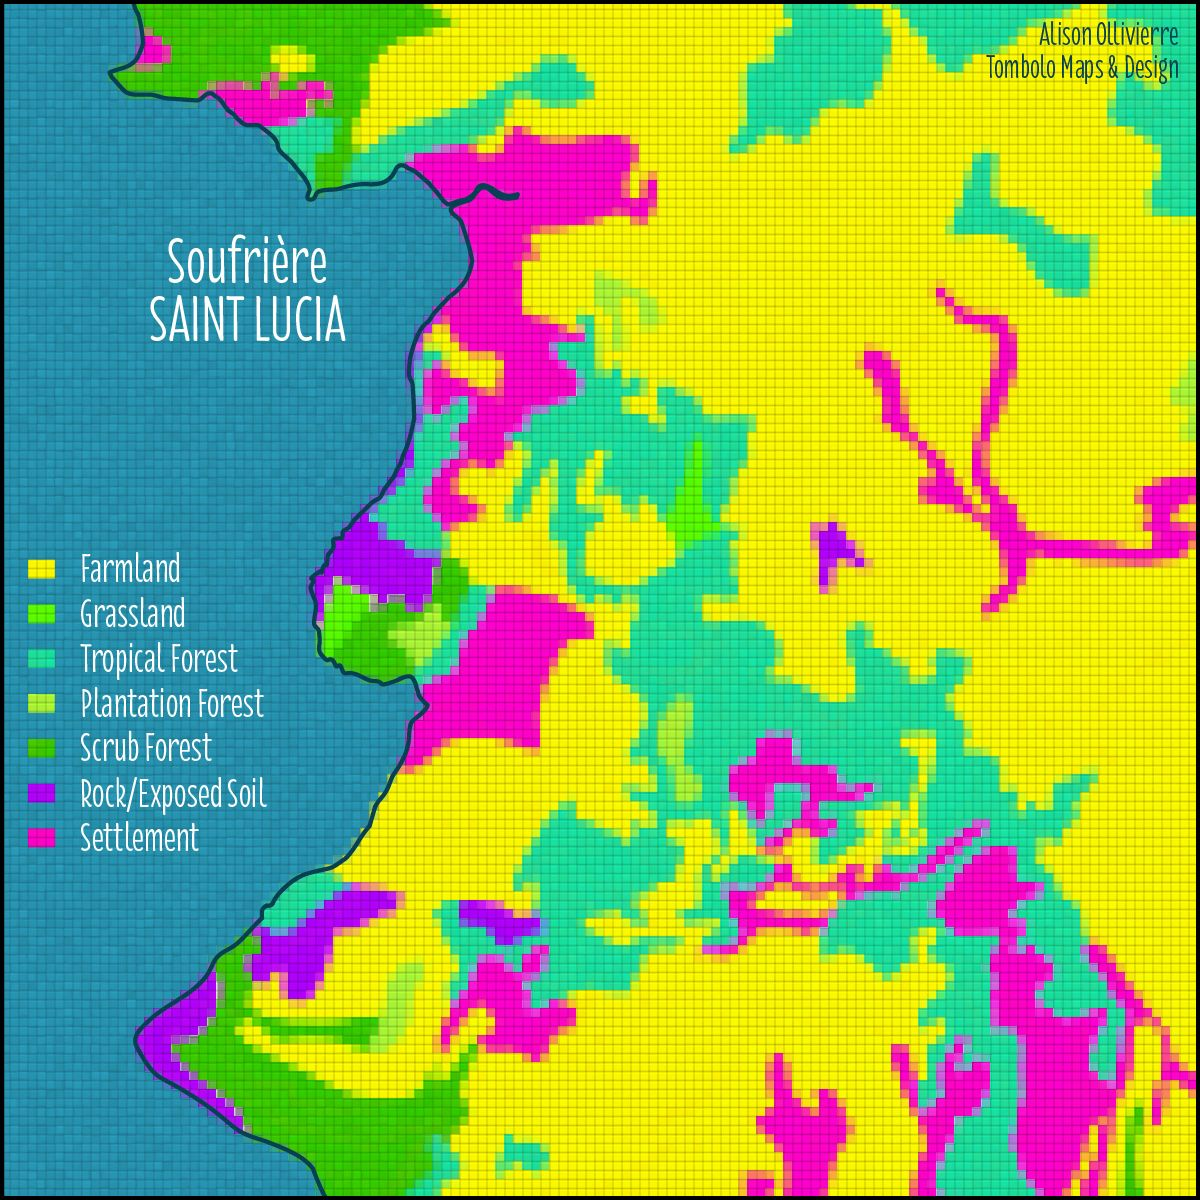
5. Alison Ollivierre – The pixelated landscape of Saint Lucia
Alison Ollivierre reimagined land-use mapping by rasterising a map of Soufrière, Saint Lucia, into a grid of colourful pixels. This stylistic choice, transforming tropical forests and farmland into a digital mosaic, bridges classic cartography with a modern, cellular aesthetic. The result is a compelling abstraction that simplifies complex landscape information into an instantly readable visual.
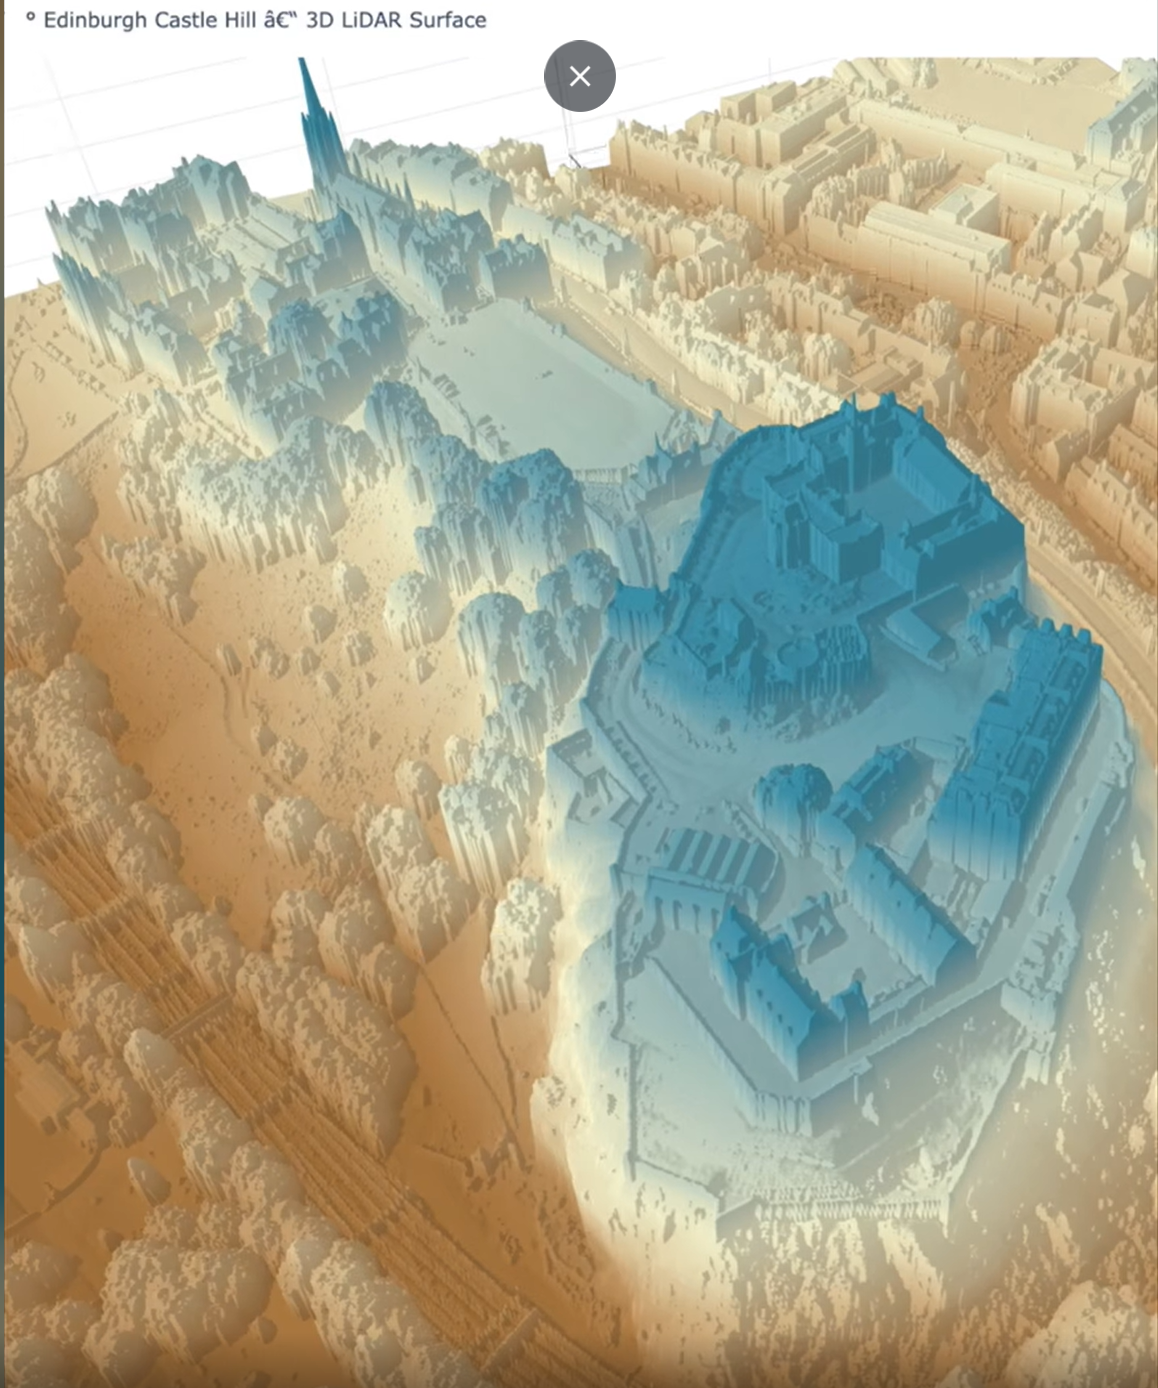
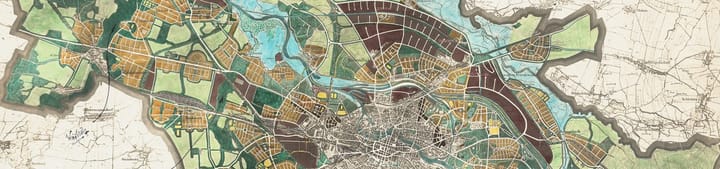
4. Milan Janosov – A cellular view of Edinburgh Castle
Using high-resolution 50cm lidar data, Milan Janosov constructed a stunning 3D model of Edinburgh Castle and its surroundings. His Python-driven approach treated each elevation point as a cellular building block, assembling them into a realistic terrain model. This work showcases how raw geospatial data, when processed with skill, can create immersive, small-scale representations of iconic places.
3. Carl Churchill – Capturing a supercell’s fury
As a graphics reporter for The Wall Street Journal, Carl Churchill visualised the raw power of a supercell thunderstorm using mobile radar data from the University of Oklahoma. The map captures the storm’s intricate internal structure—its rotating updraft and precipitation core—transforming a violent meteorological event into a precise, analytical image that reveals the hidden architecture of severe weather.
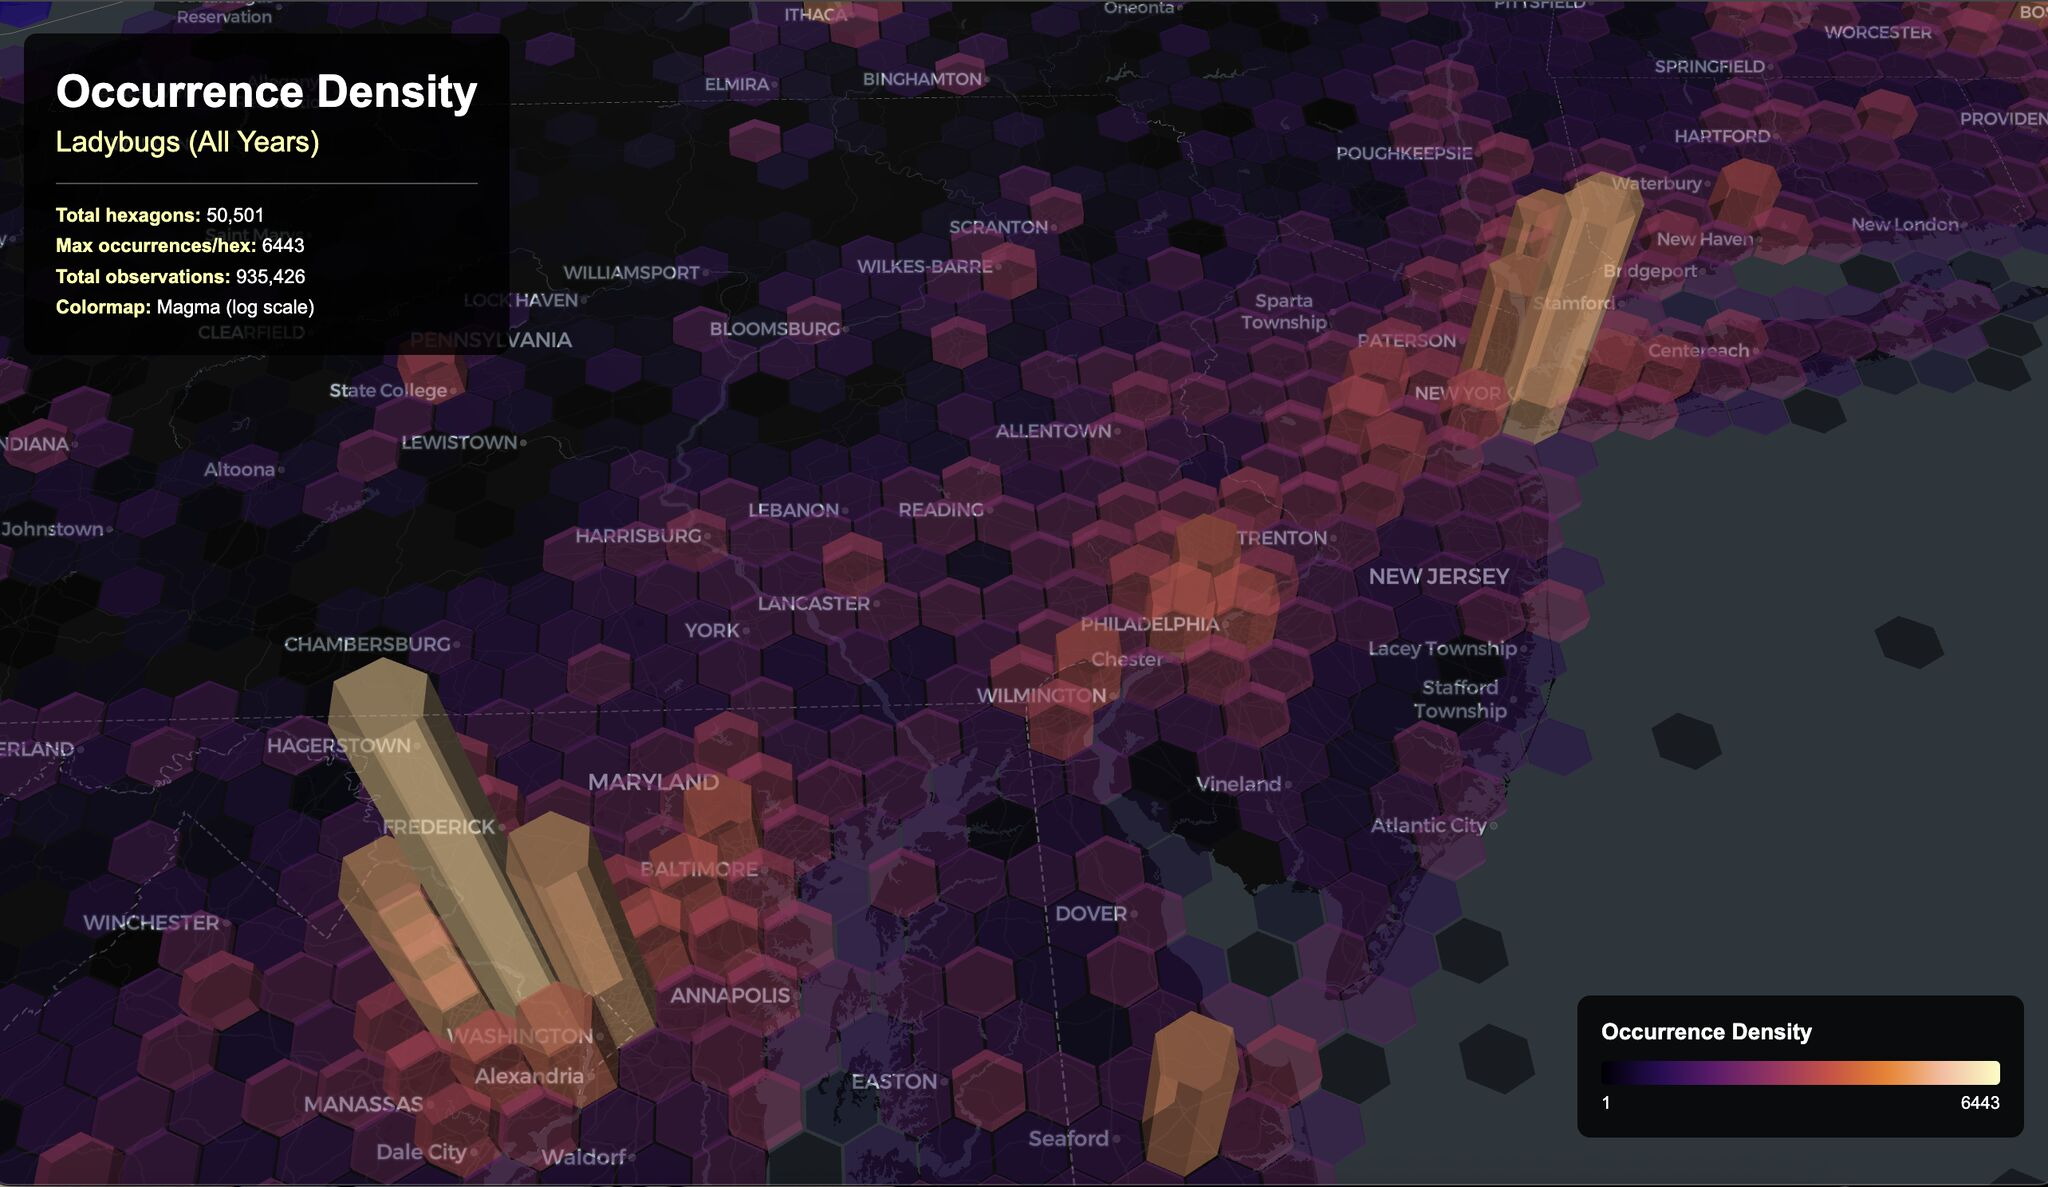
2. Steph Wever Schulman – The secret world of Ladybugs
In a tribute to her son’s love of bugs, Steph Wever mapped global ladybug occurrences using H3 hexagonal binning. Each hexagon acts as a biological cell, revealing patterns of species density and biodiversity corridors. This approach transforms scattered species data into a coherent story about ecological connectivity, proving that even the smallest creatures can illustrate grand patterns of life on Earth.
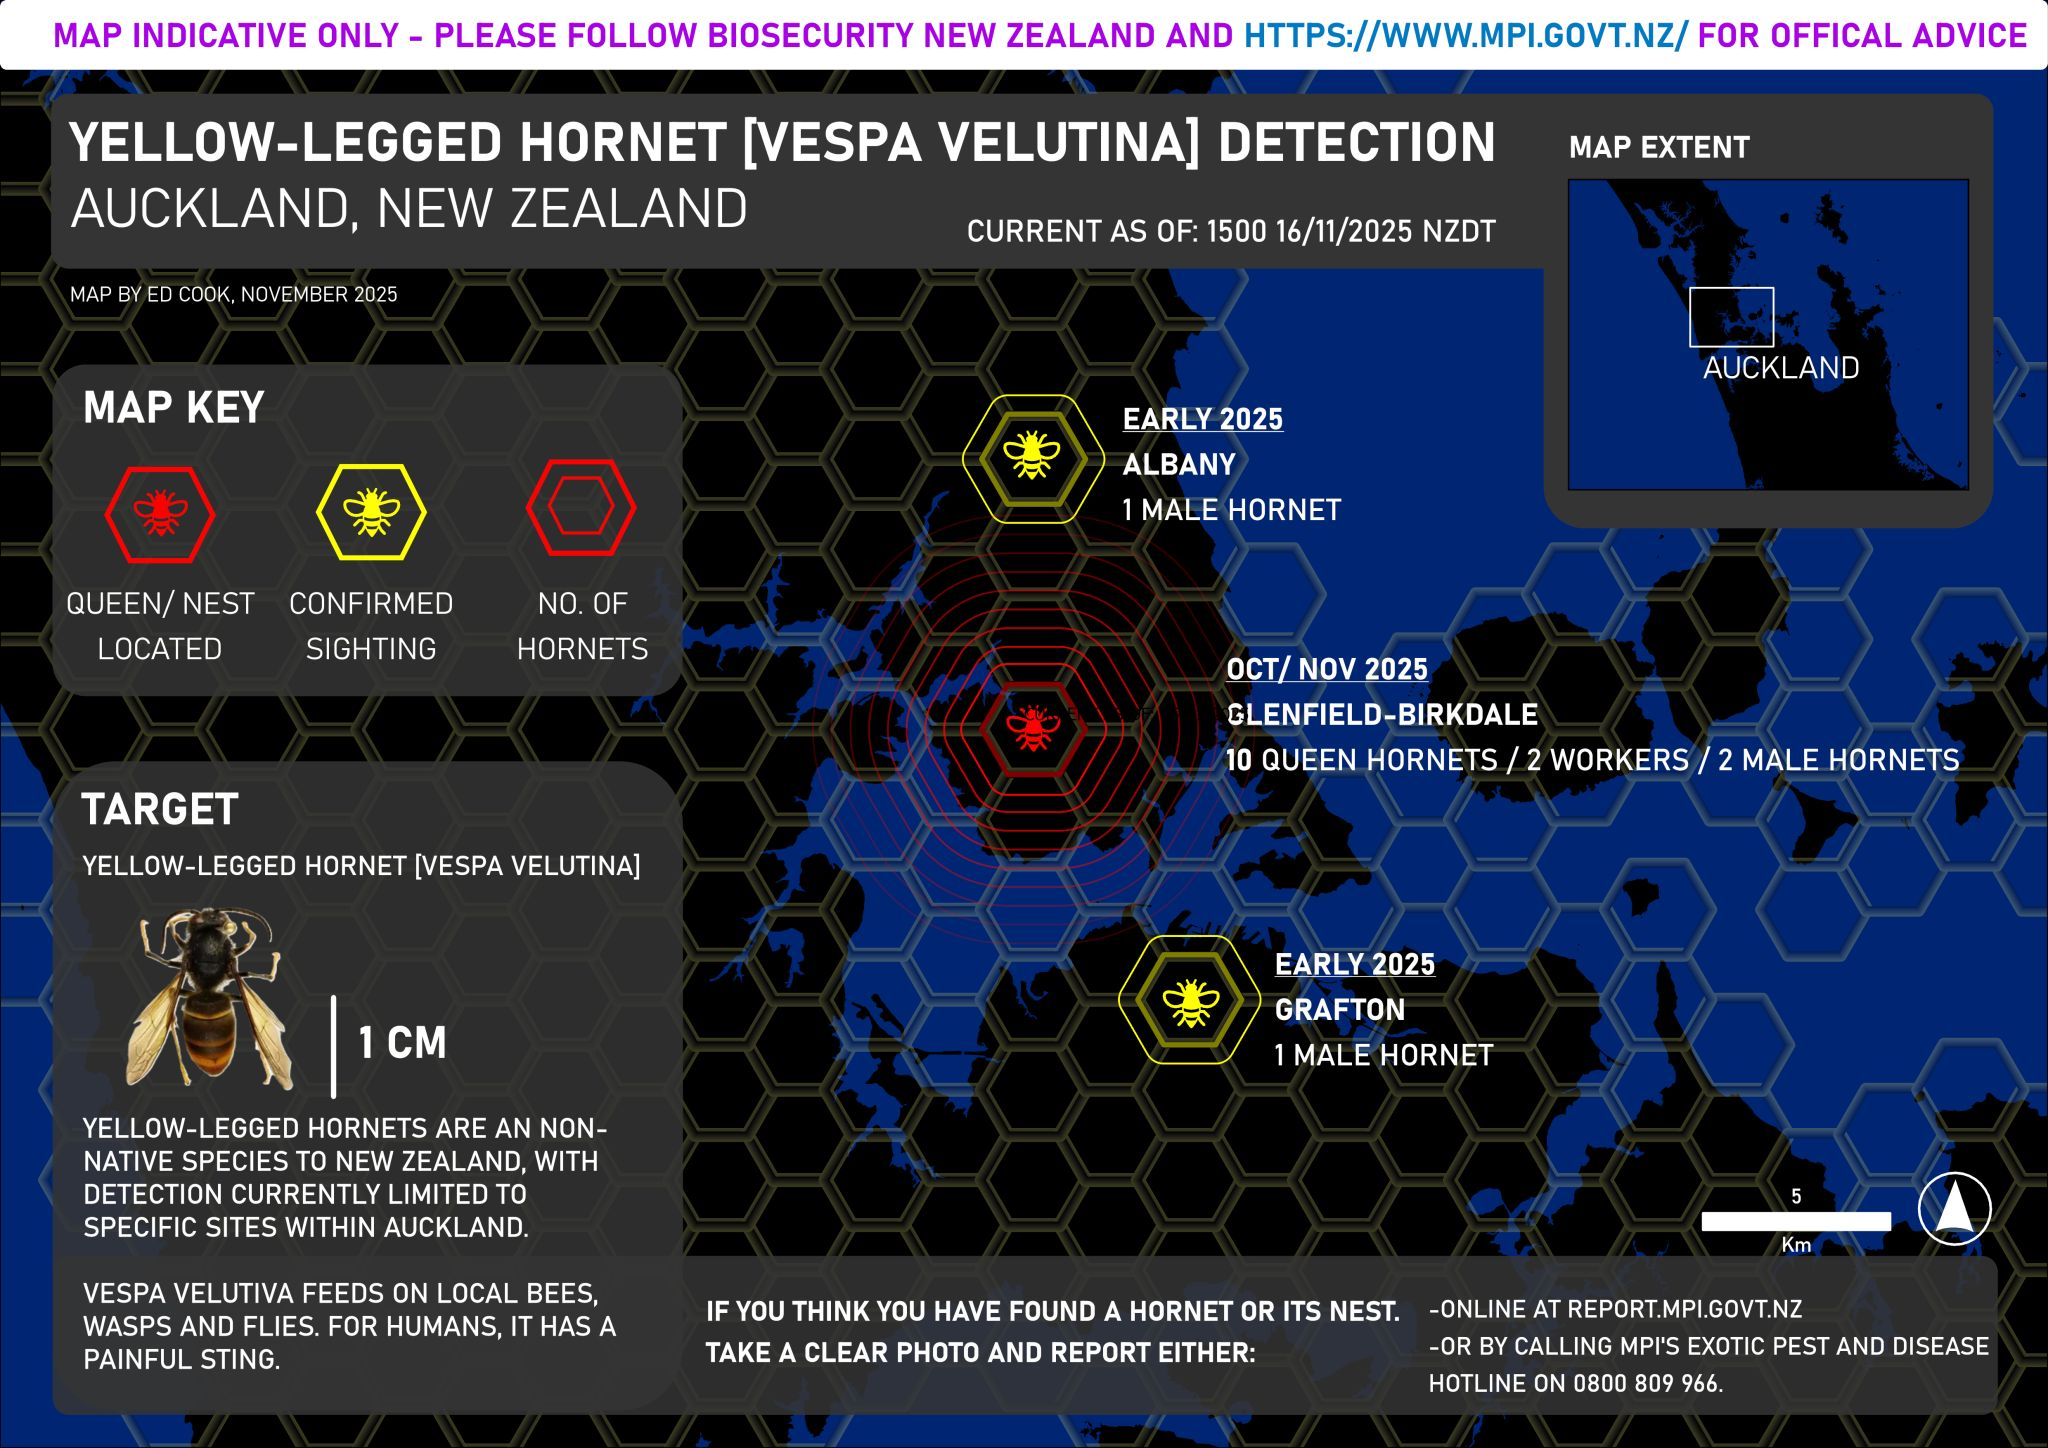
1. Ed Cook – Tracking an invasion, one Hornet at a time
Topping our list is Ed Cook’s urgent and precise map of Yellow-Legged Hornet detections in Auckland, New Zealand. Created in ArcGIS Pro with public data from Biosecurity New Zealand, each “cell” in this context is a discrete sighting or nest location. The map serves as both a real-time tactical dashboard and a public warning, demonstrating how cellular data can be deployed in the critical defense against invasive species.
Together, these maps reveal a fundamental truth in modern cartography: whether examining landscapes, storms, insects, or castles, the choice of cellular unit—be it a pixel, a hexagon, or a data point—becomes the foundational language for telling a story. In an age of big data, the cell remains cartography’s most powerful elementary particle.


Comments ()