
#30DayMapChallenge: Dimensions
The top Dimensions maps from Day 6, featuring 3D population, ocean depths, and hurricane impacts.
Yesterday's maps broke out of 2D to show depth, height, and population in stunning 3D. Here are my top 5 picks counting down to number one:
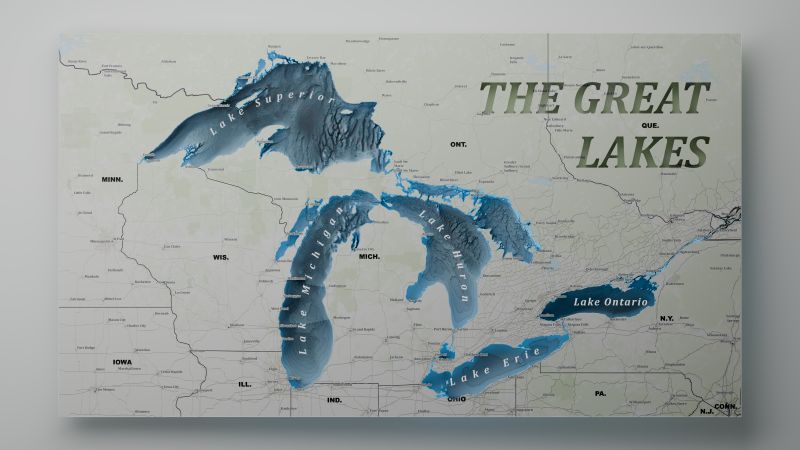
5. Jonah Blackmon – Great Lakes Bathymetry
A clean 3D render of the Great Lakes using NOAA bathymetry data, showing the dramatic underwater landscape.
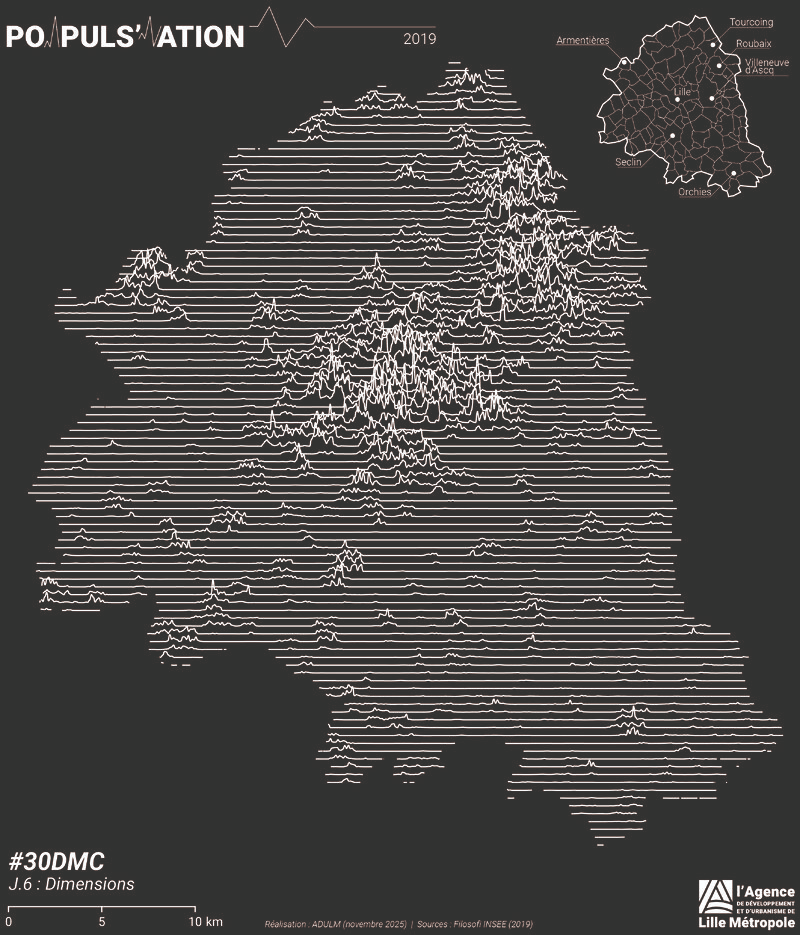
4. Samuel Decressac – Lille Metro Population Joyplot
A creative joyplot visualisation of population density in Lille, inspired by Joy Division's iconic album cover artwork.
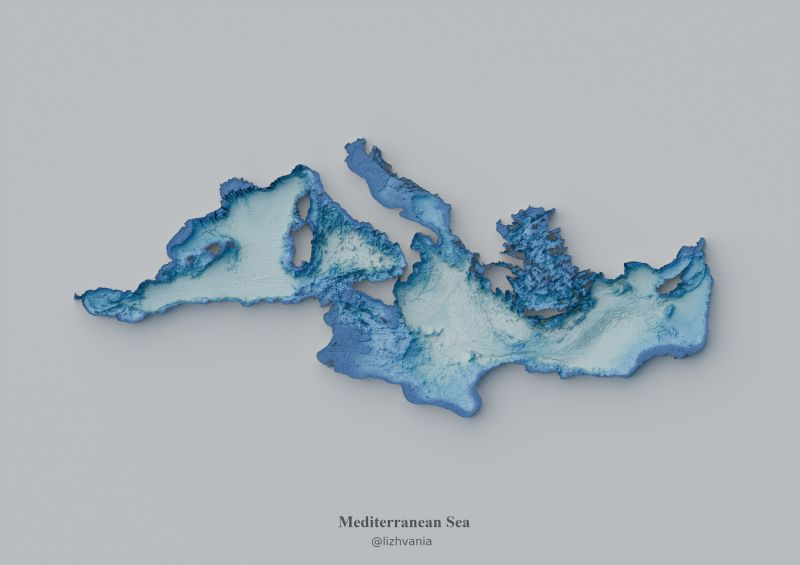
3. Lika Zhvania – Mediterranean Sea Floor
A beautiful dive beneath the surface revealing the colourful underwater topography of the Mediterranean using open-source tools.
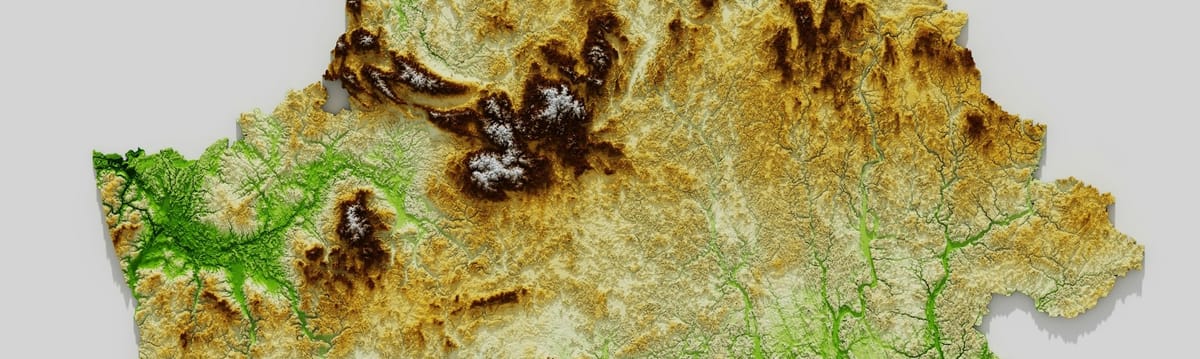
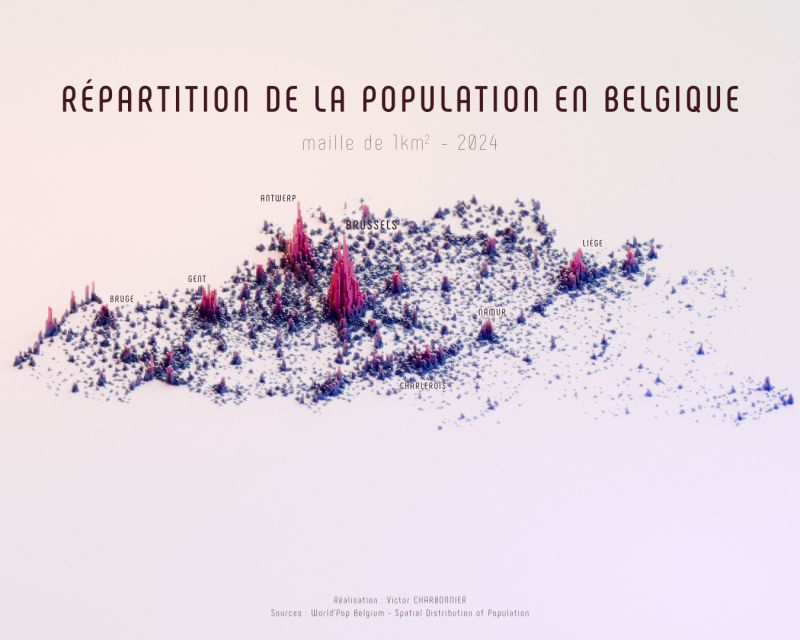
2. Victor Charbonnier – Belgium Population Distribution
An elegant 3D population map of Belgium showing density variations across the country in striking visual form.
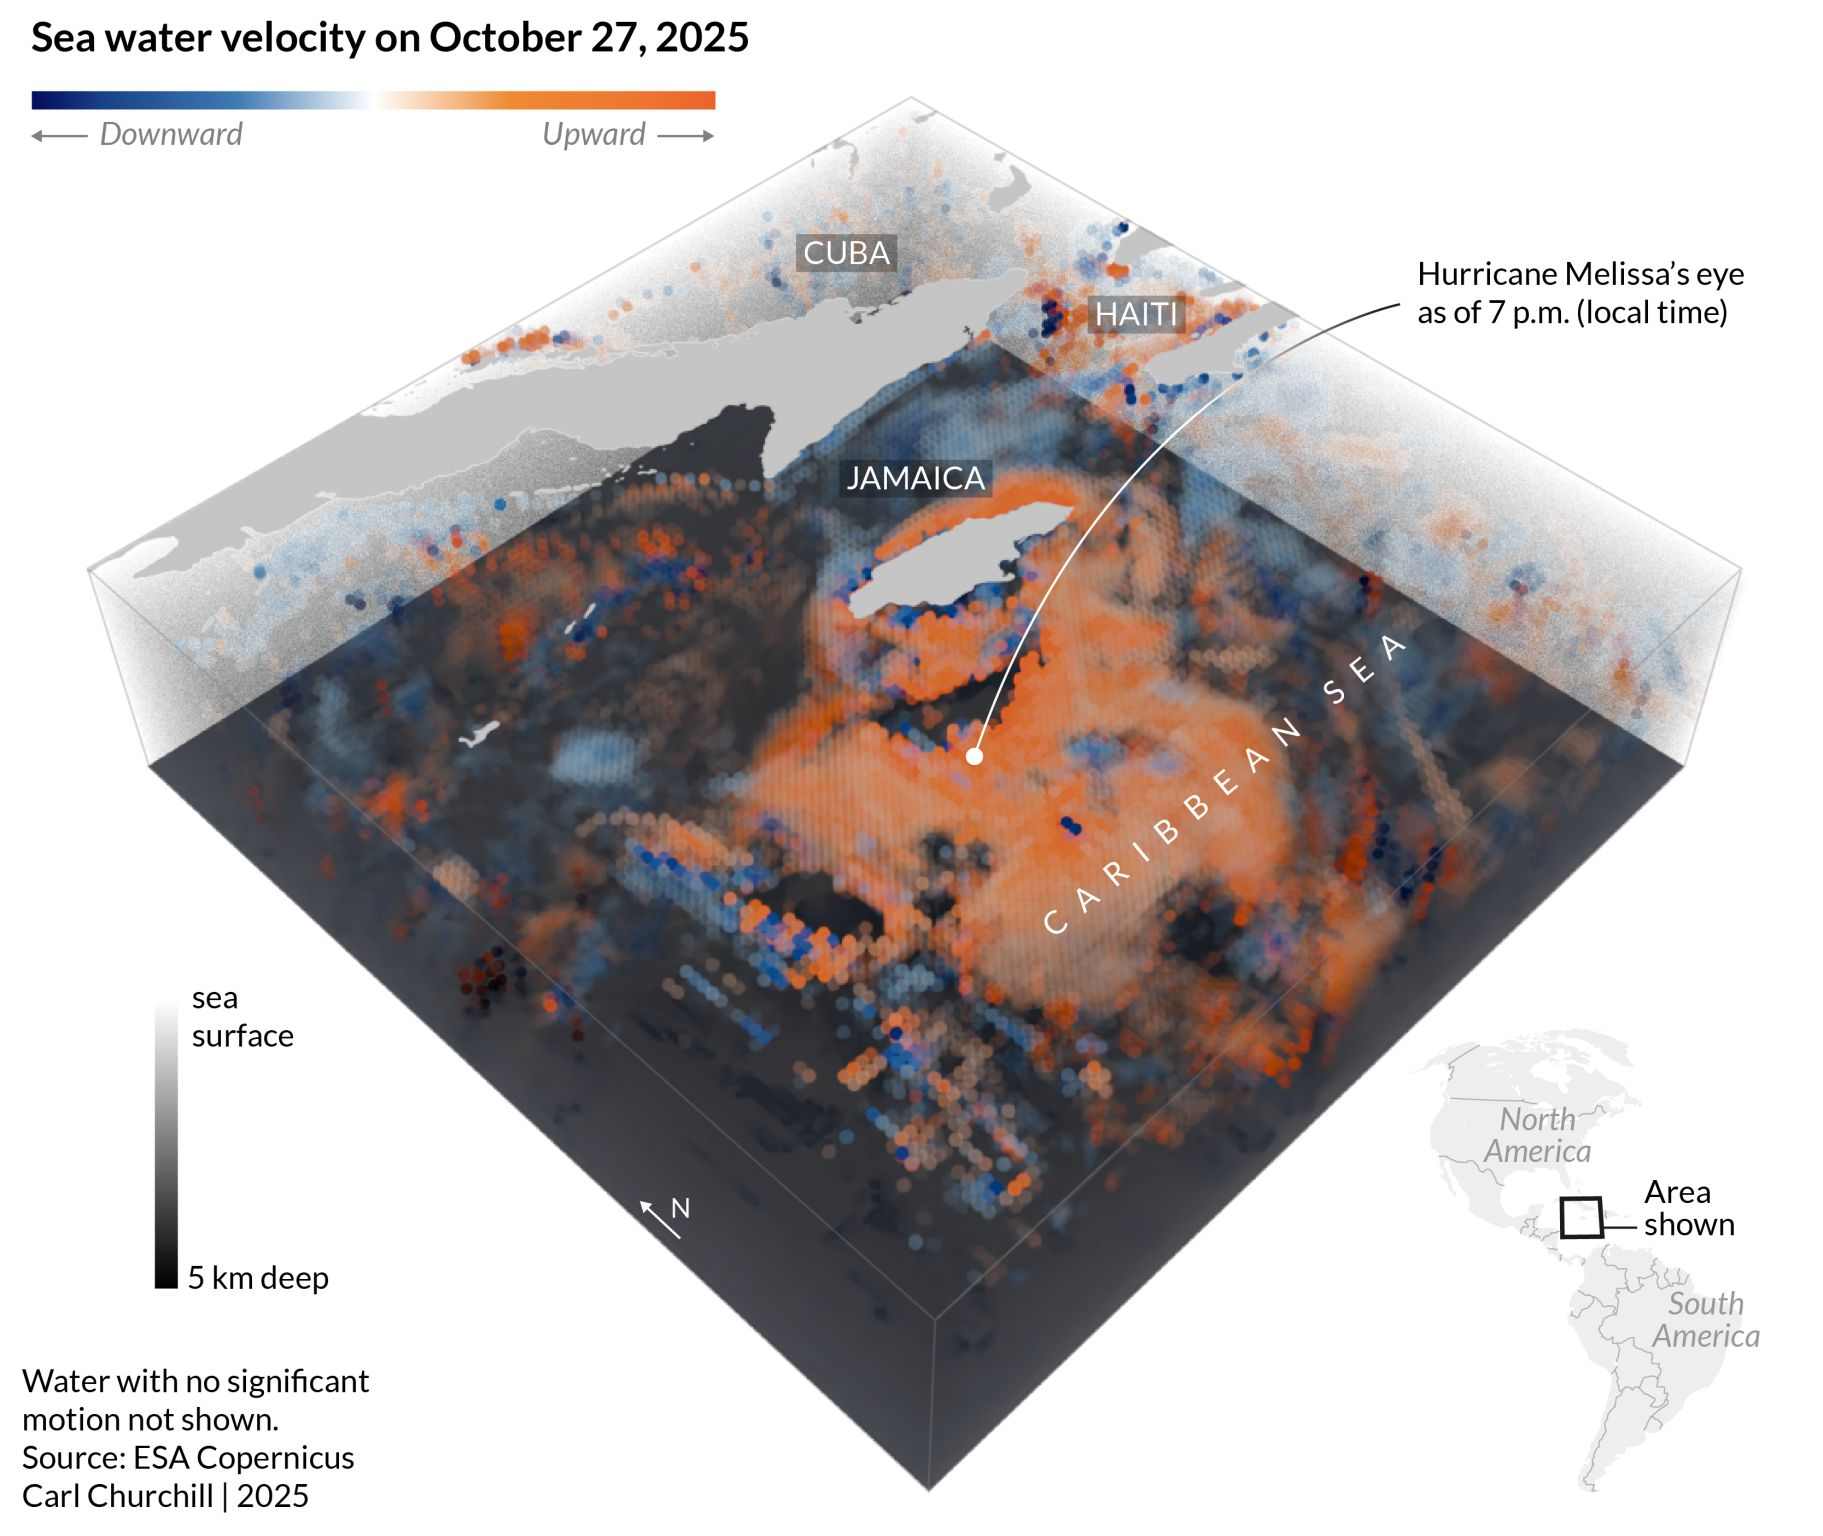
1. Carl Churchill – Hurricane Melissa Ocean Impact
My top pick - a stunning scientific visualisation showing how Hurricane Melissa pulled water upward from 5 km deep, revealing the hurricane's powerful 3D impact on ocean structure.
These maps prove that adding the third dimension can reveal patterns and stories impossible to see in flat maps!
Which dimensional map expanded your perspective today?


Comments ()