
#30DayMapChallenge: Fire
From historical analysis to real-time alerts, Day 15's fire maps showcased the power of geospatial data.

The Fire theme pushed cartographers to visualise one of the planet's most powerful and destructive forces. The results ranged from intimate portraits of single wildfires to sweeping views of global fire activity, all leveraging powerful public data to tell urgent stories. Here are five standout approaches:
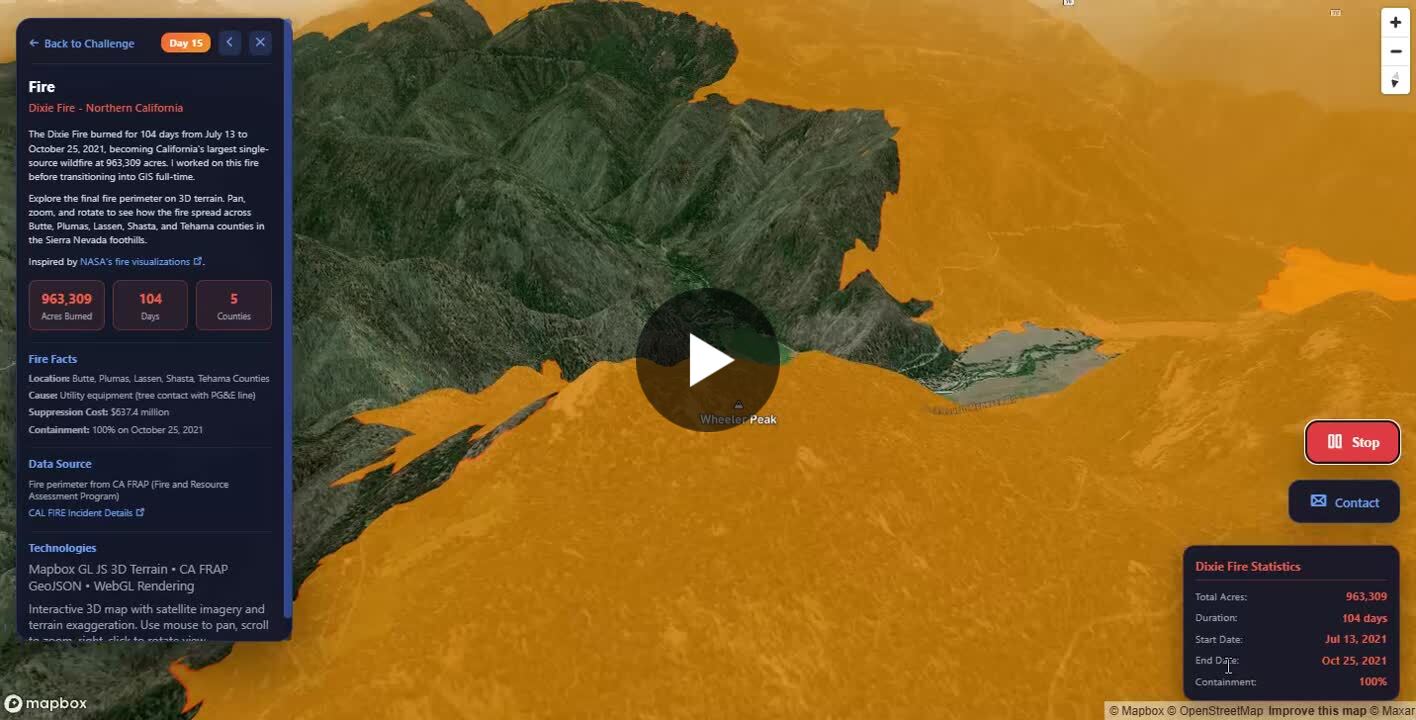
5. Mike Peckham: Dixie fire in California
Mike visualised the staggering 963,309-acre perimeter of California's 2021 Dixie Fire using Mapbox GL JS with 3D terrain. His first-hand firefighting experience informs this powerful depiction of how extreme topography shapes mega-fires.
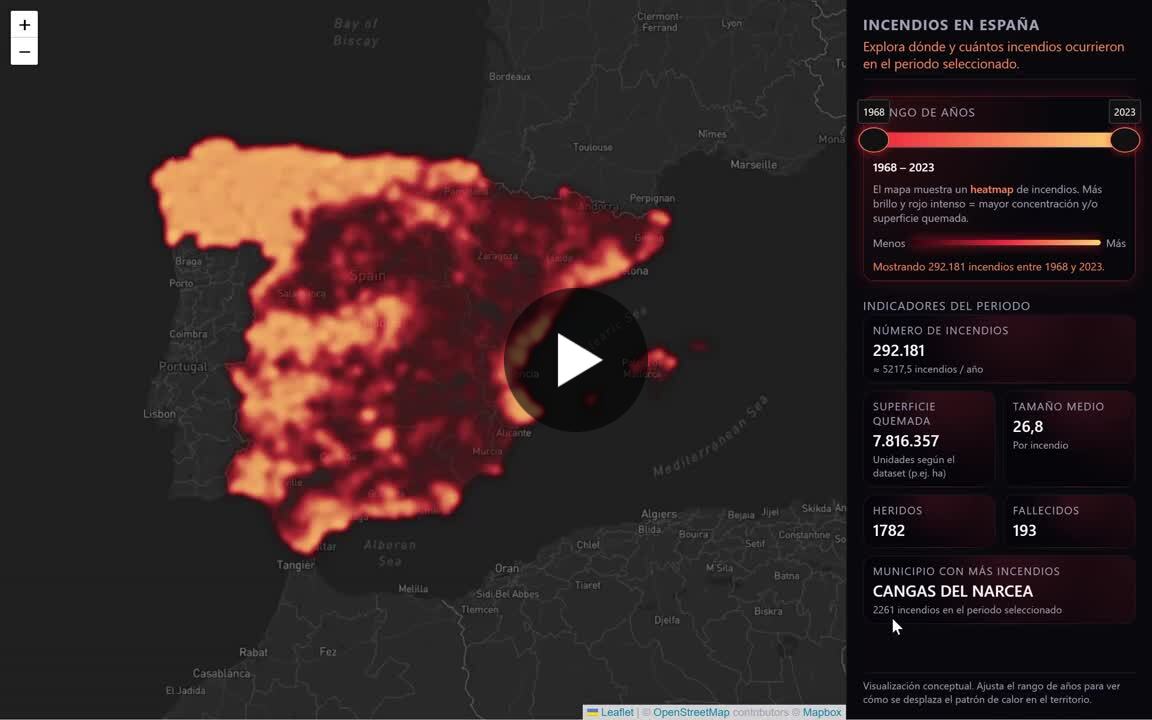
4. Alejandro Quinto Ferrández: A half-century of Spanish fires
Alejandro built an interactive dashboard analysing 55 years of Spanish wildfire data (1968-2023). This sophisticated web tool lets users explore fires through time with sliders, tracking incidents, burned area and human impact.
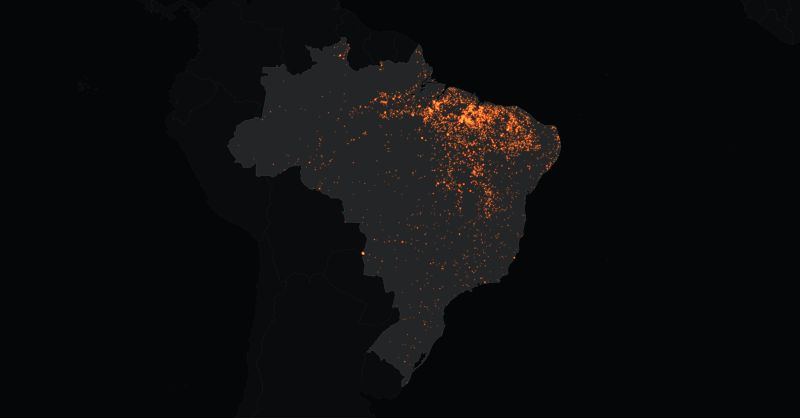
3. Juanchi Parra: Active fires and thermal anomalies in Brazil
Juanchi created a clear, immediate snapshot of active fires in Brazil using NASA satellite data and D3.js. Focusing on thermal anomalies from the past seven days, this minimalist approach prioritises timeliness and clarity.
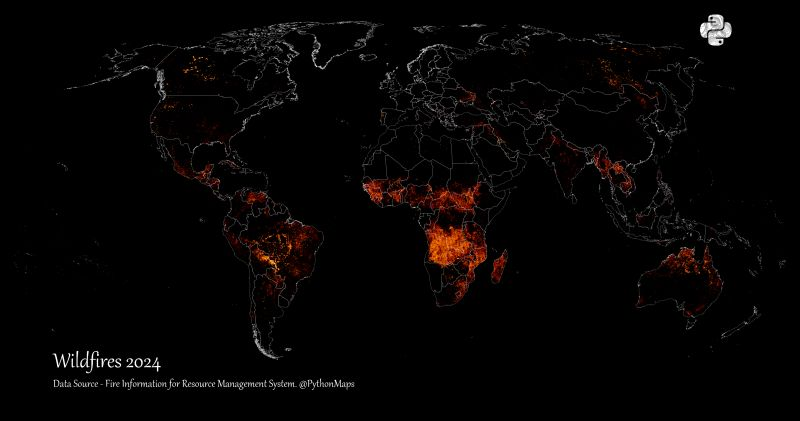
2. Adam Symington: Global wildfires in 2024
Adam synthesised a full year of global wildfire data from NASA's FIRMS into a single comprehensive map. This Python-powered visualisation provides the essential macro-level perspective for understanding 2024's fire patterns.
1. MapCey Global: Fire activity
MapCey created a striking rotating 3D globe showing global fire hotspots from the past year. Using MODIS data and Mapbox GL JS, they transformed complex satellite information into an engaging planetary view. The glowing points effectively communicate fire intensity and distribution across continents.

Together, these maps form a powerful narrative: from historical analysis to real-time monitoring, and from local terrain to a global view, geospatial data is our most vital tool for understanding, managing, and responding to the challenge of fire in a changing world.


Comments ()