
#30DayMapChallenge: Lines
From tranquil train rides to furious cyclones, discover the top 5 line maps from Day 2 of the #30DayMapChallenge.
From train rides to ocean currents, Day 2’s Lines theme showcased how powerful simple geometries can be in telling rich geographic stories. Here are my top picks from the submissions I saw:
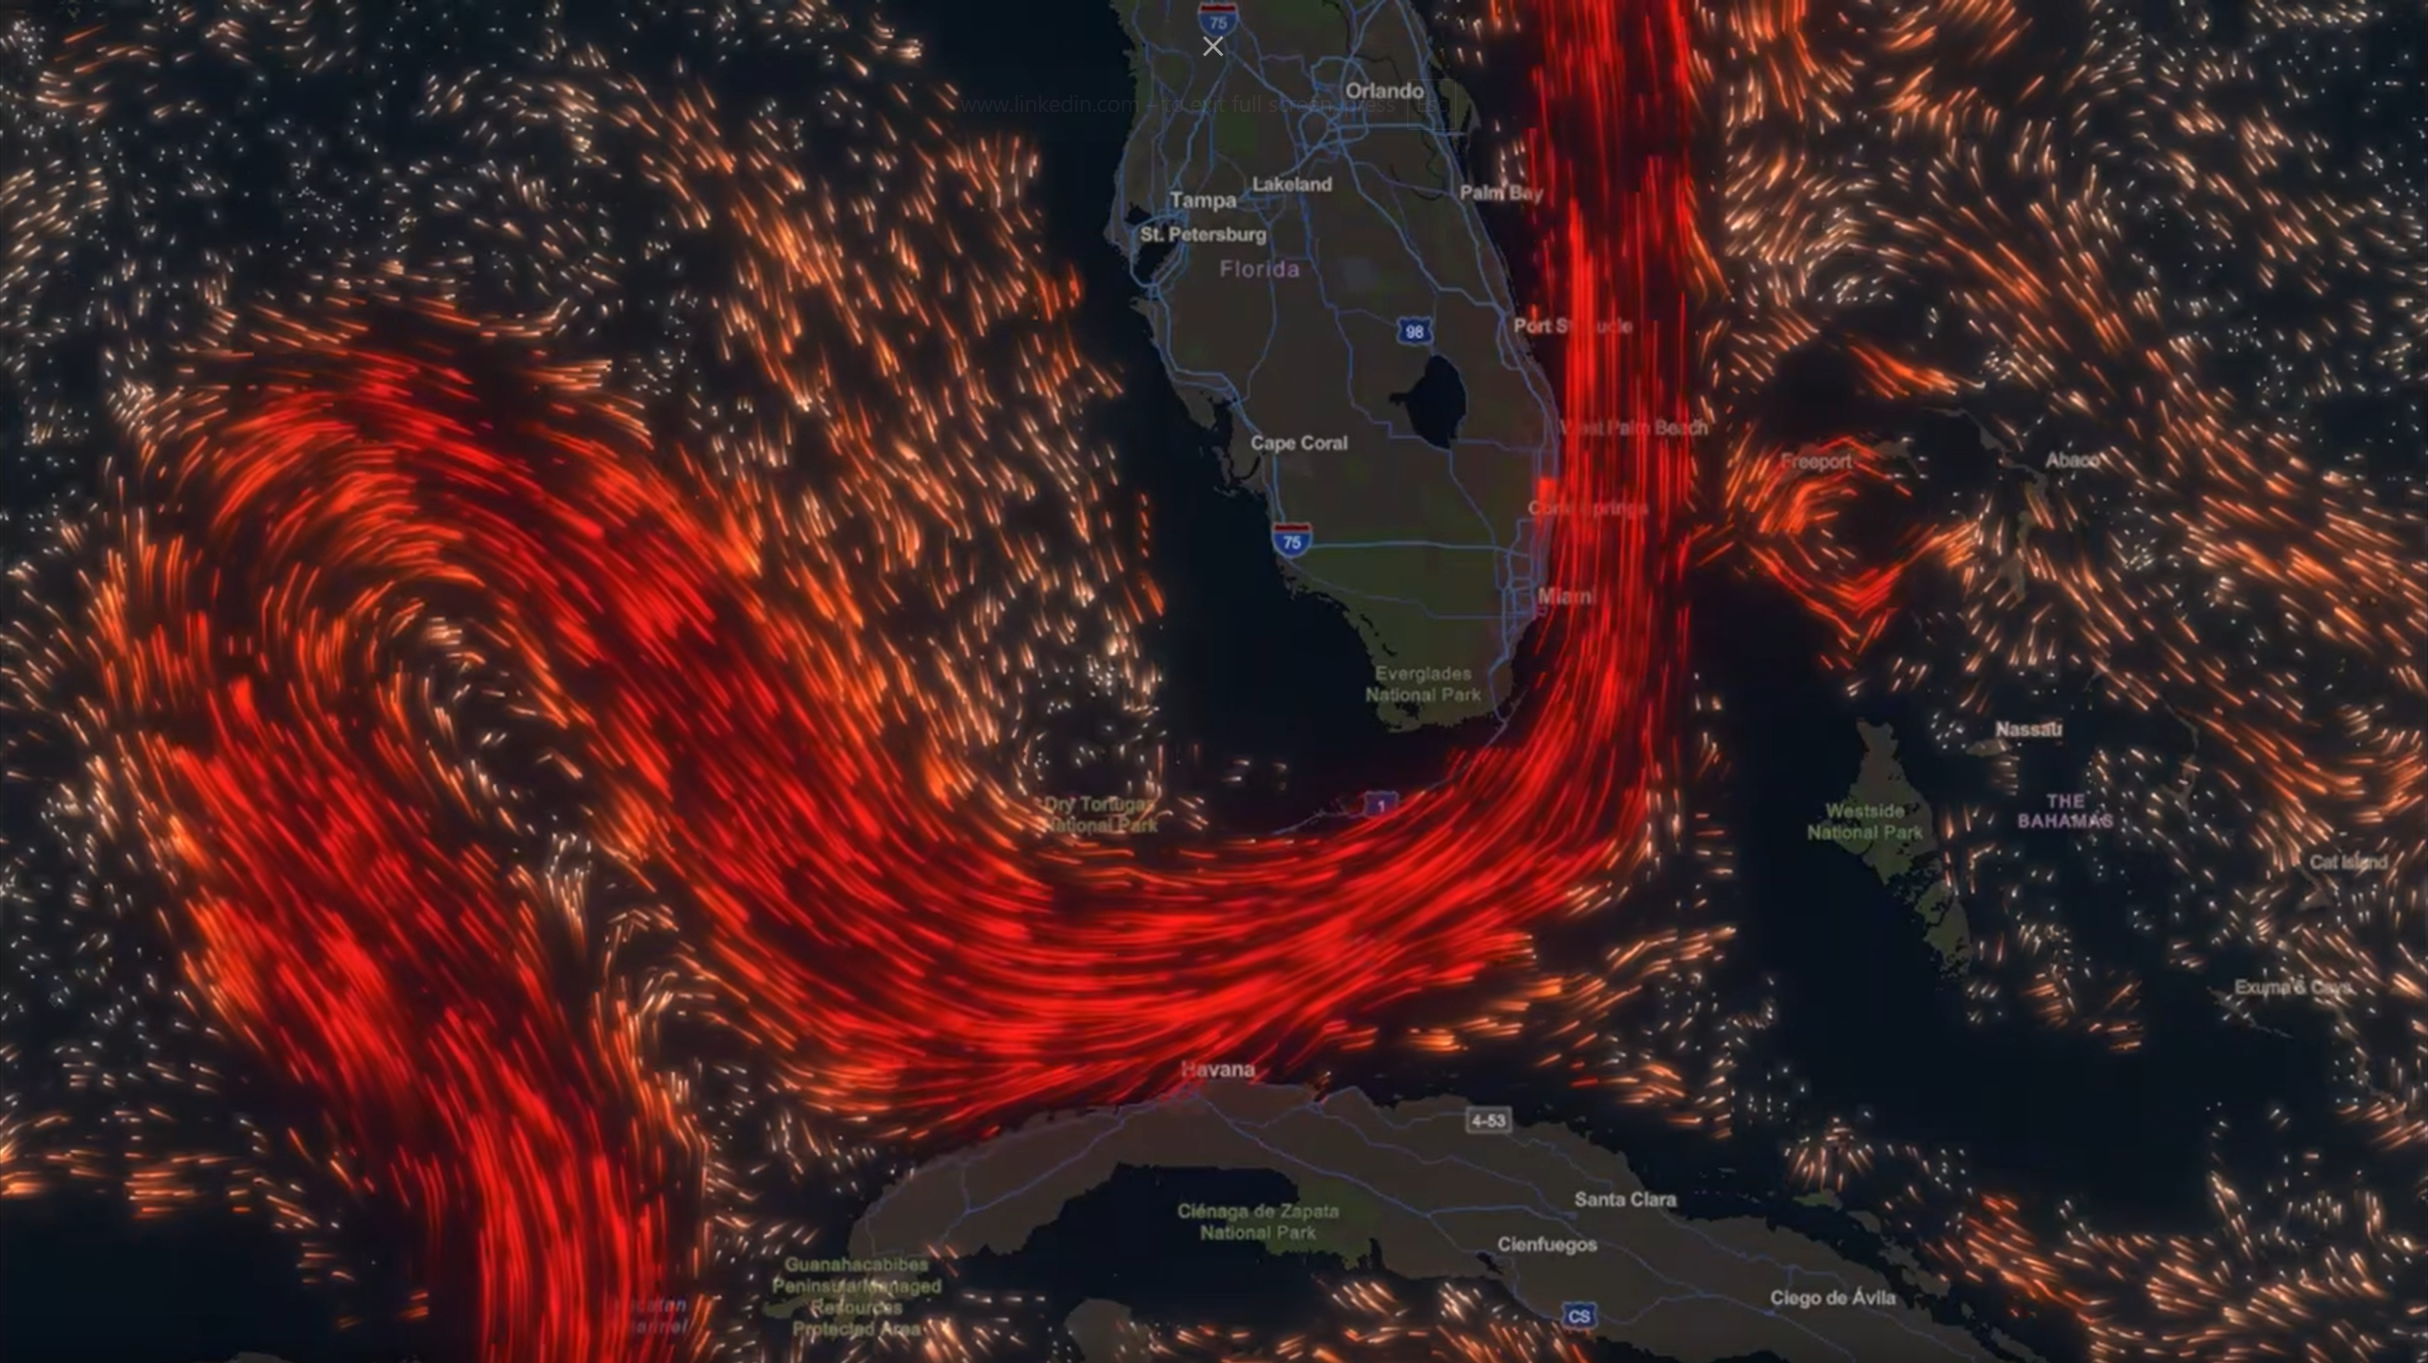
5. Tsvetomir Angelov – Ocean Currents Visualisation
Hypnotic flow lines depicting ocean surface currents around Florida and the Gulf of Mexico, using an eye-catching red colour scheme.
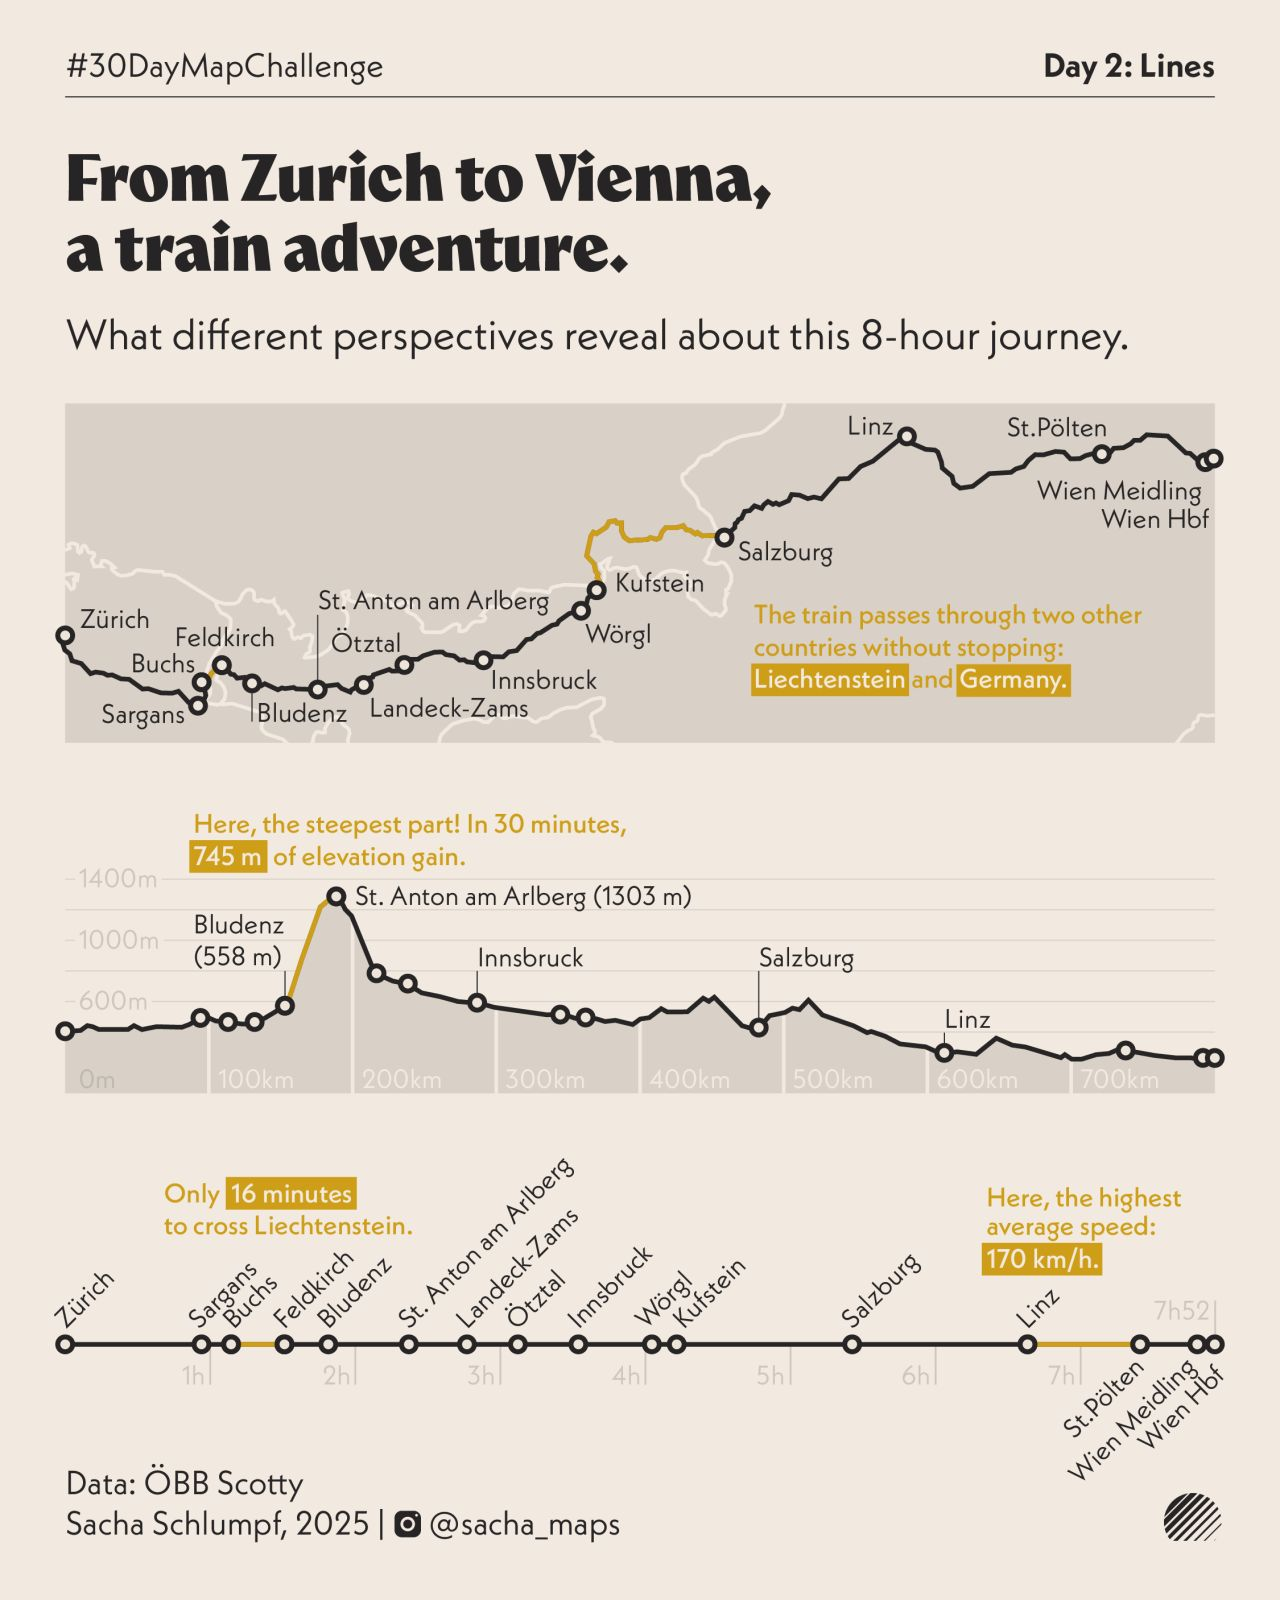
4. Sacha Schlumpf – Zurich-Vienna Train Journey
A beautifully personal infographic mapping the scenic ÖBB train route, complete with elevation profile that explains the snowy landscapes along the way.
3. Ariel Dome – Philippines Submarine Cable Map
Clean and modern visualisation of the undersea fiber-optic cables connecting the Philippines to the global internet infrastructure.

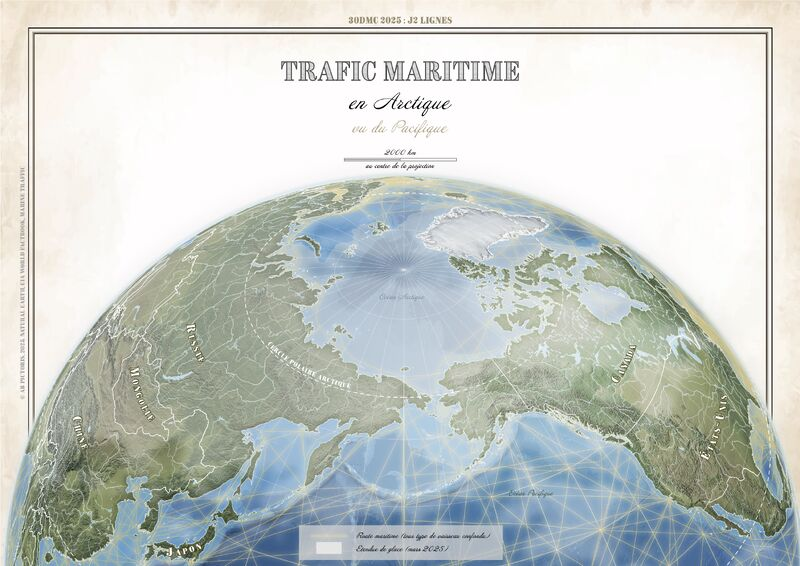
2. Blanche Lambert – Arctic Maritime Traffic
Stunning orthographic projection showing shipping lines in the Arctic Pacific region, with beautiful cartographic styling.
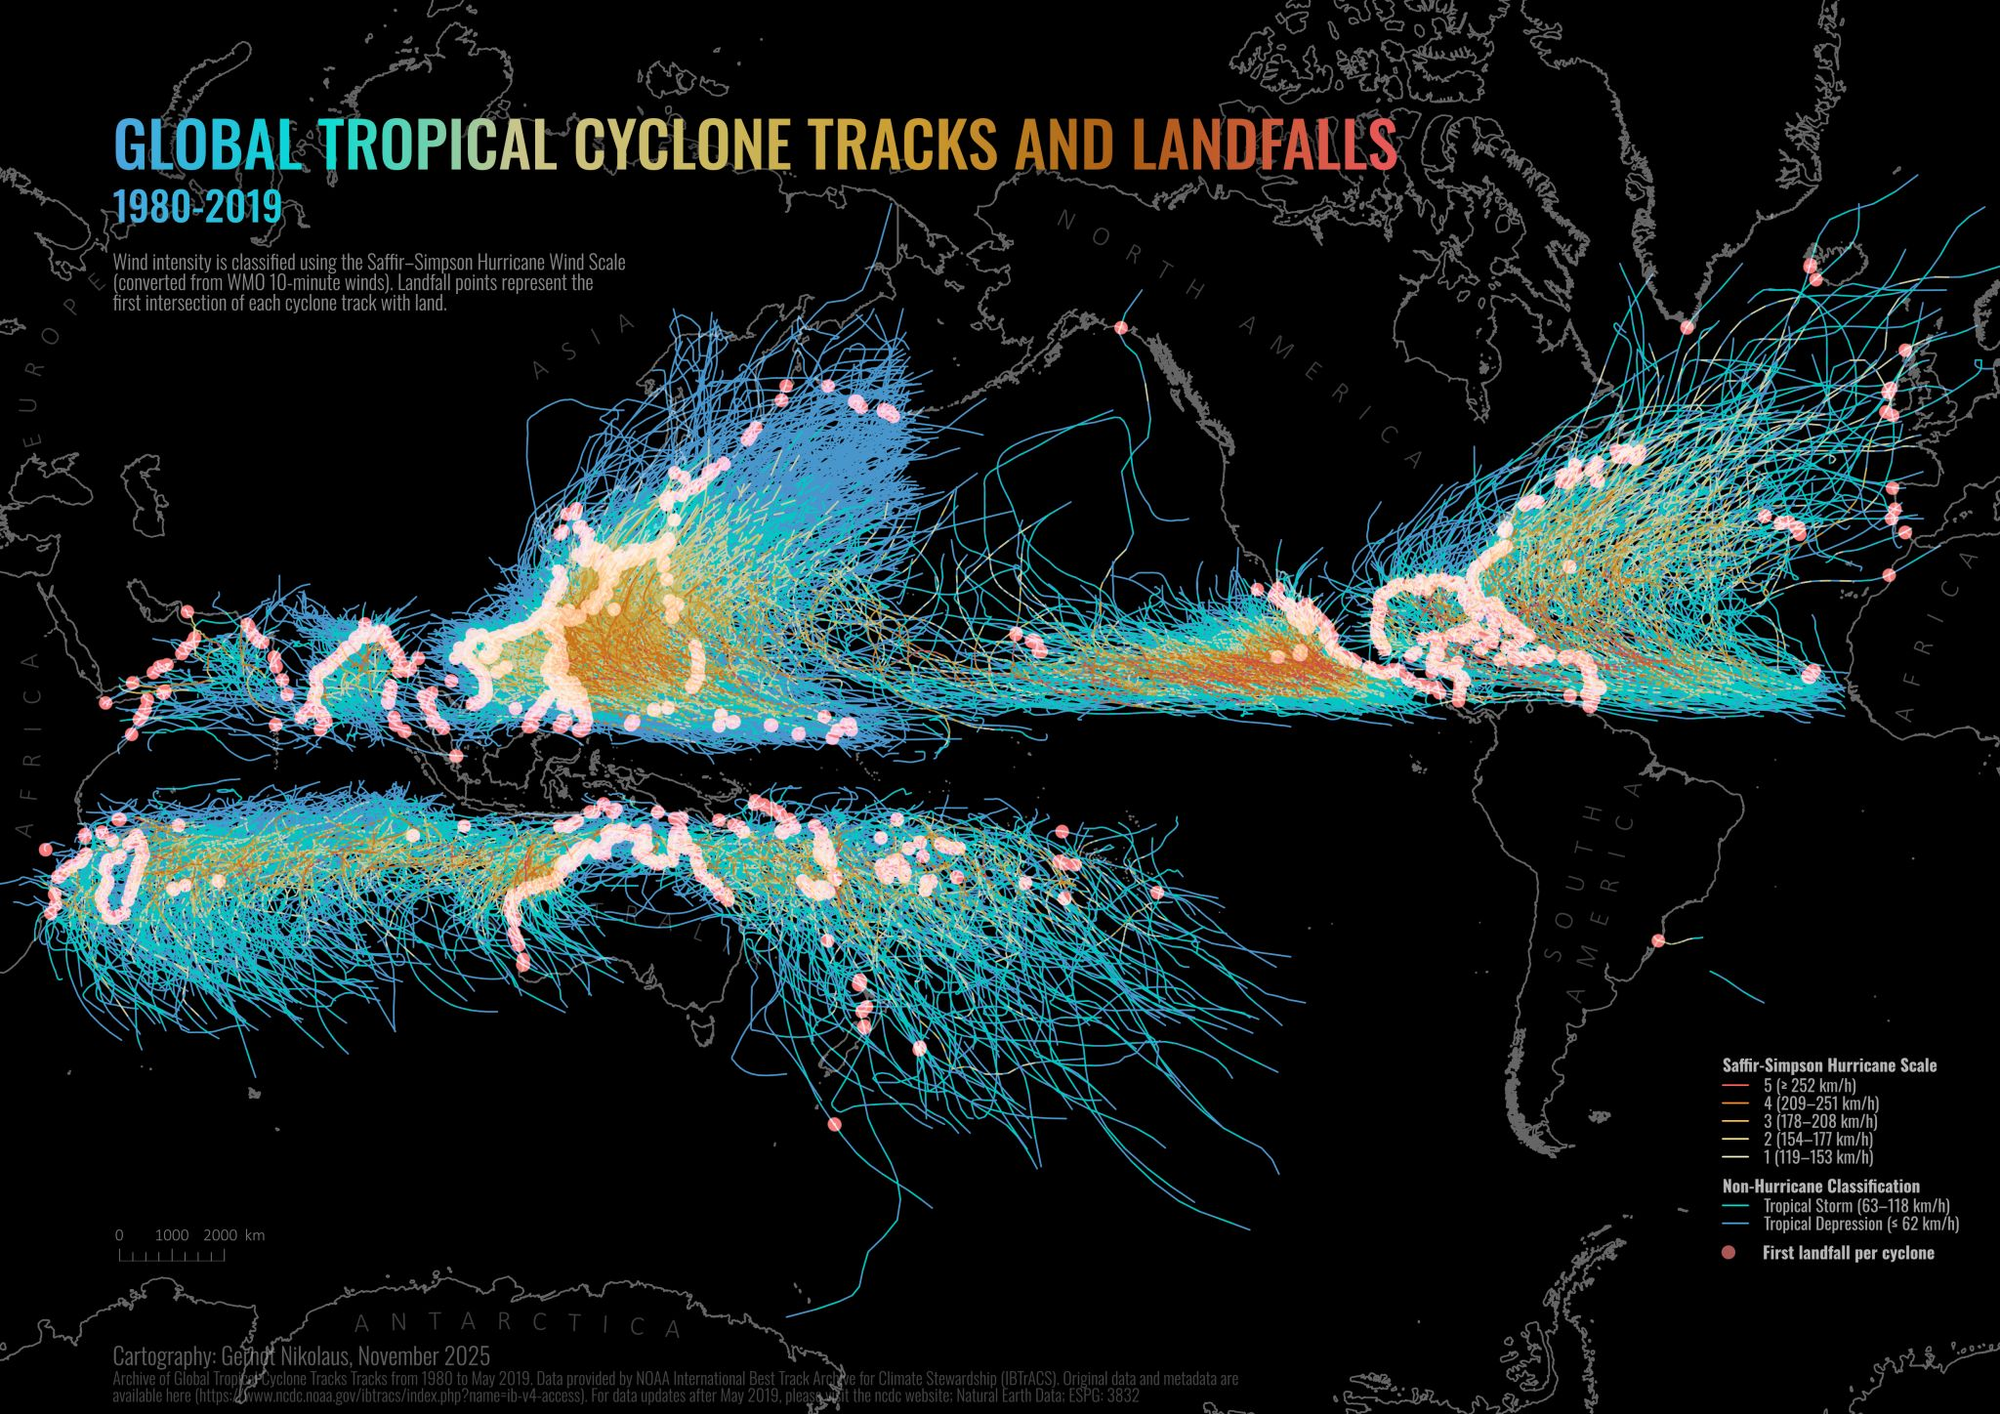
1. Gernot Nikolaus – Global Tropical Cyclone Tracks
My top pick for its powerful climate storytelling – visualising 40 years of cyclone paths and landfalls, coloured by intensity on the Saffir-Simpson scale.
The creativity in visualising different types of linear data, from transportation to climate to infrastructure. It was truly impressive!
Which line map caught your eye from Day 2?


Comments ()