
#30DayMapChallenge: Polygons
The top 5 Polygons maps from Day 3, featuring urban timelines, border enclaves, and bathymetric masterpieces.
From urban landscapes to powerful human stories, Day 3's Polygons theme revealed the storytelling power of shapes. Here are my top 5 picks counting down to number one:
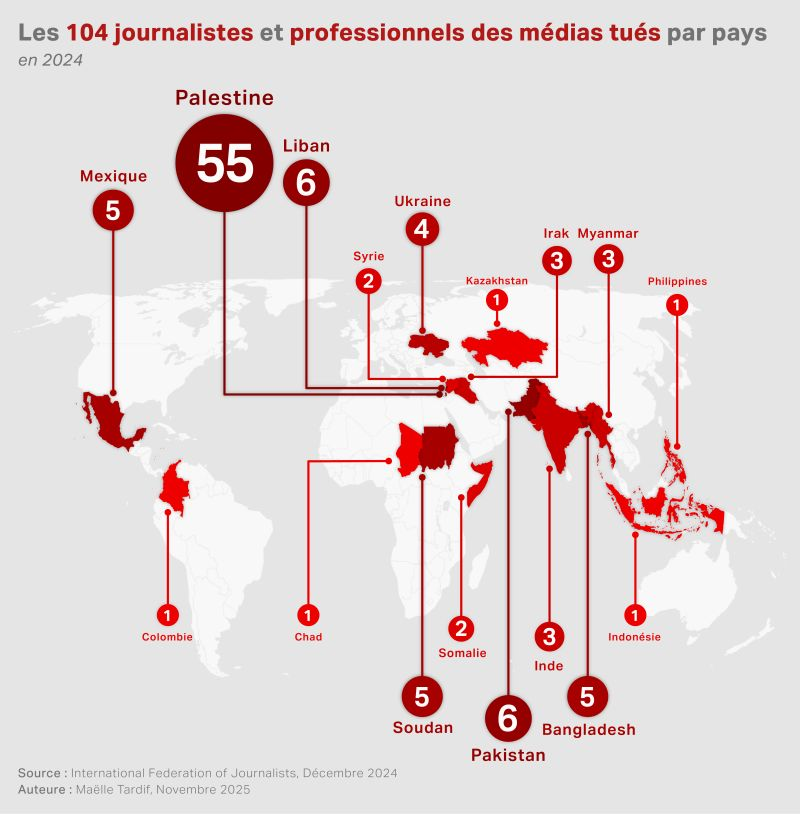
5. Maëlle Tardif – Journalists Killed in 2024
A powerful humanitarian map showing media professionals killed worldwide, created for International Day to End Impunity for Crimes Against Journalists.
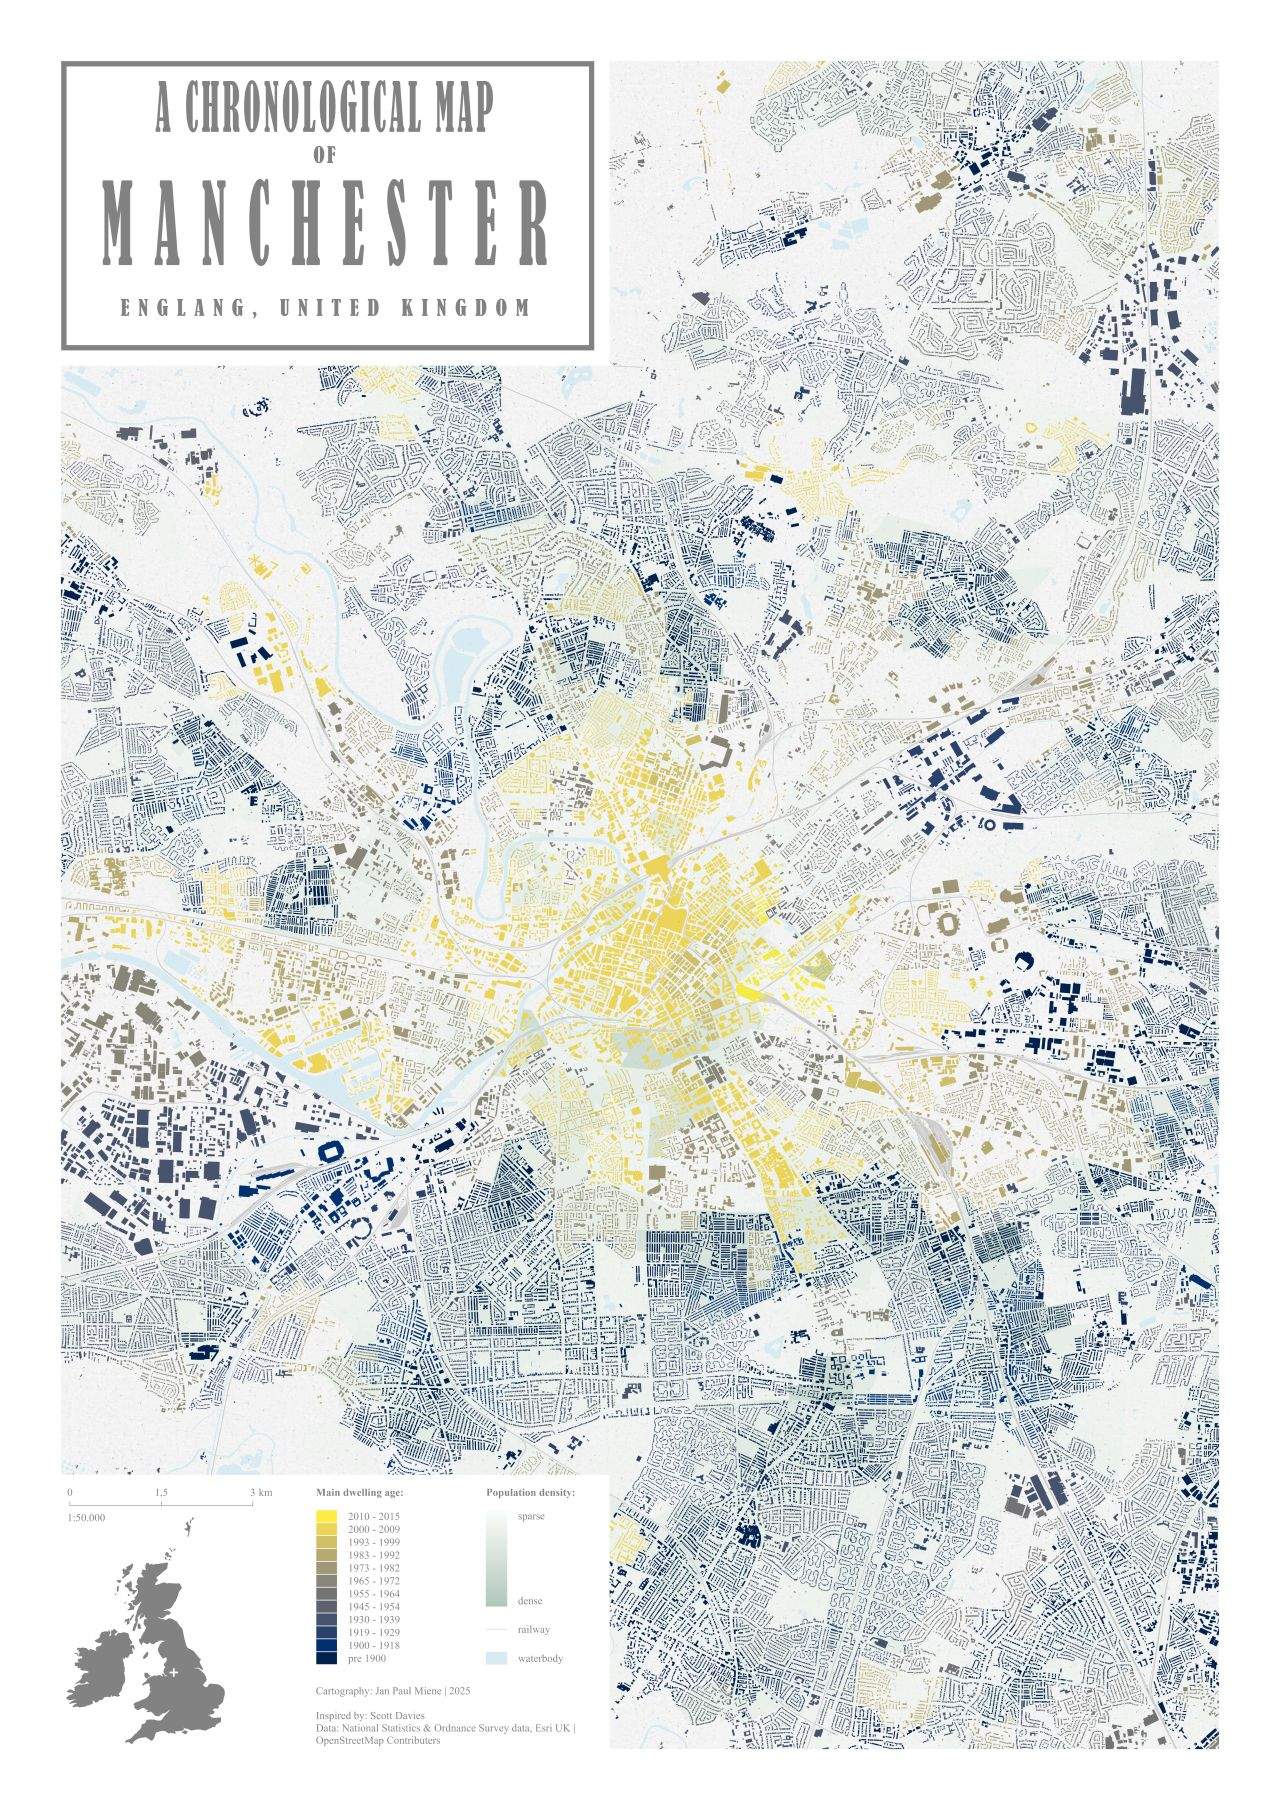
4. Jan Paul Miene – Manchester Building Ages
Fascinating urban timeline showing how dwelling ages reveal the city's evolution, with older neighborhoods surrounding a renewed city centre.
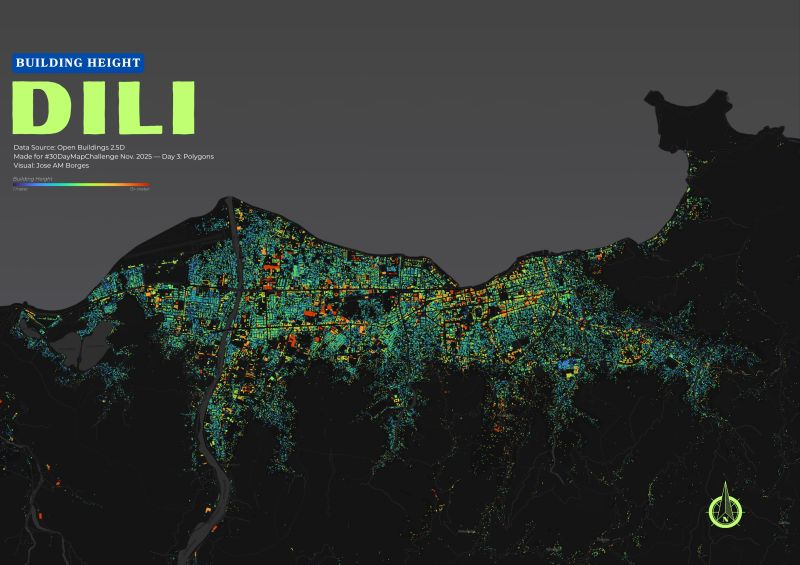
3. Jose AM Borges – Building Height in Dili, Timor-Leste
Clean visualisation of urban density using Open Buildings 2.5D data, showing estimated building heights across the city.
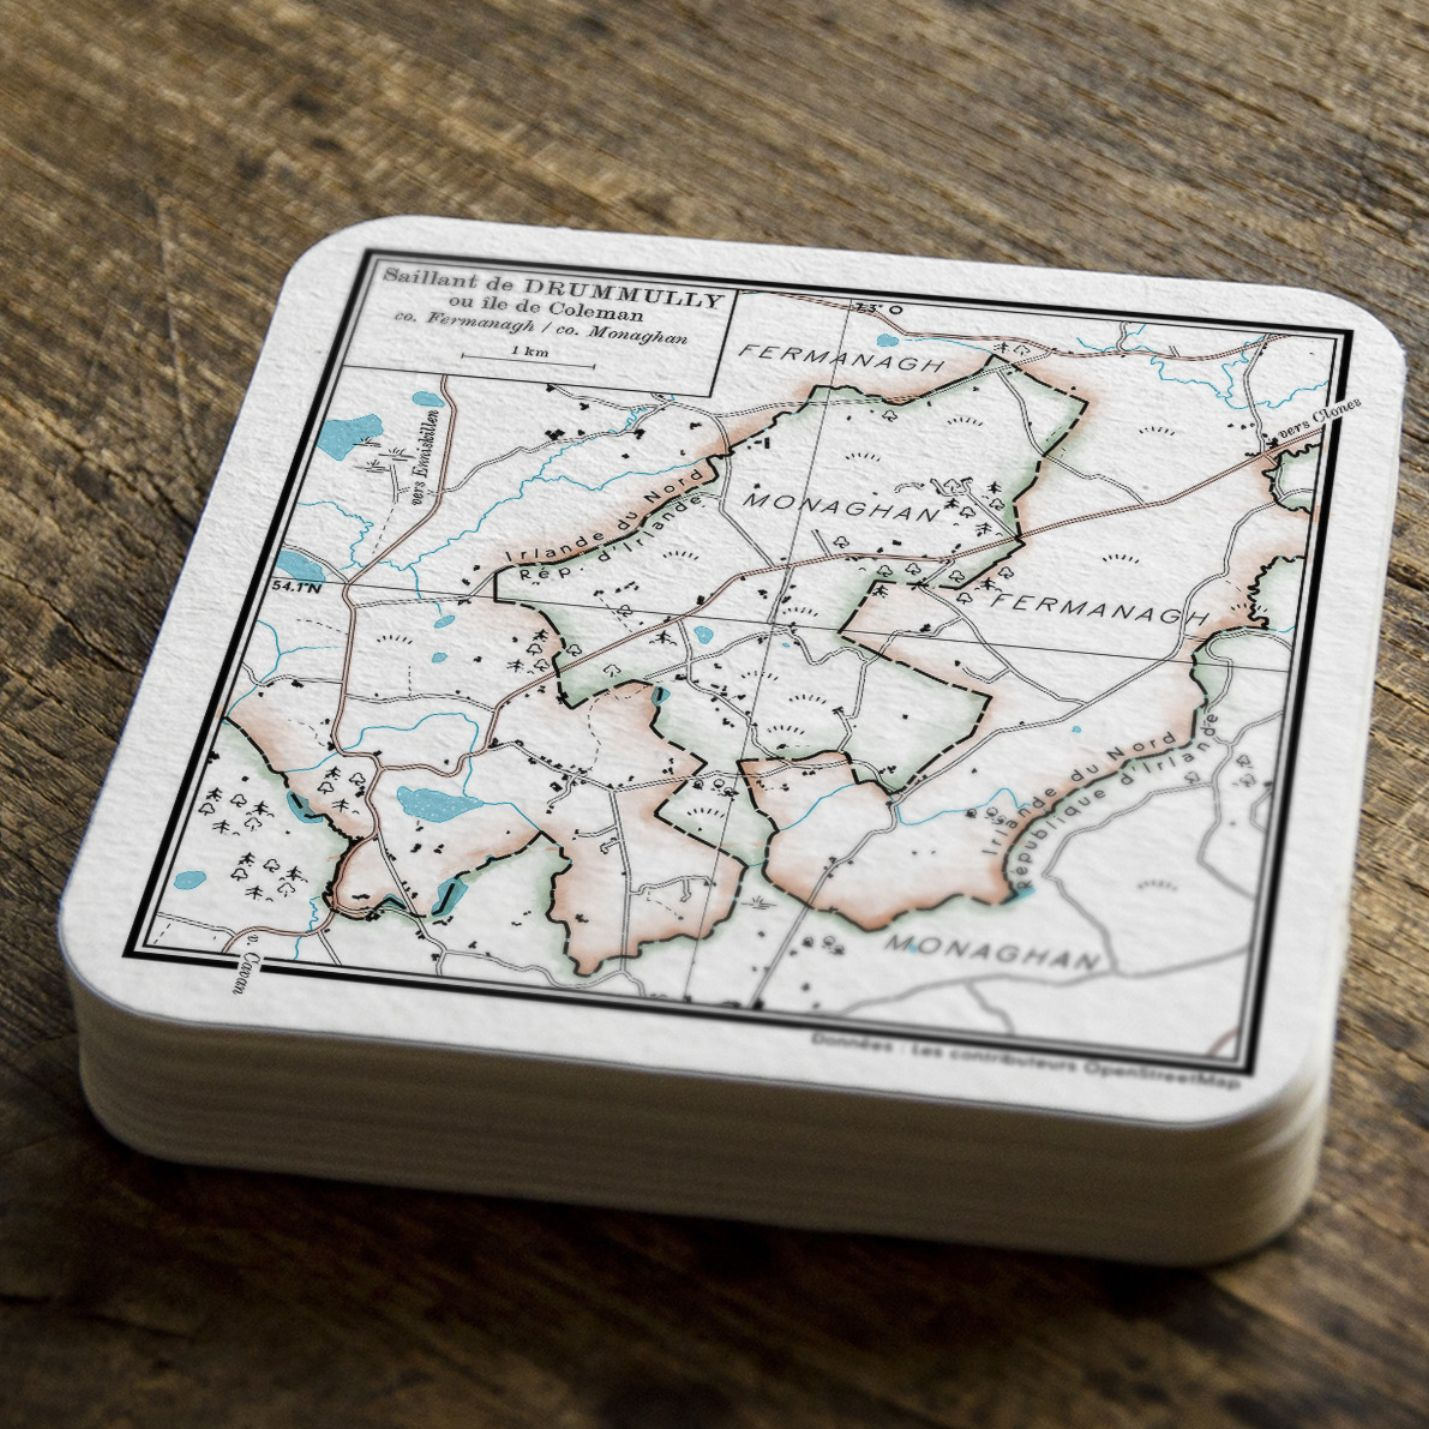
2. Laurent Gontier – The Drummully Polyp
Fascinating cartographic storytelling about the Irish border enclave where you cross between countries four times in just four minutes - a powerful Brexit-era narrative.
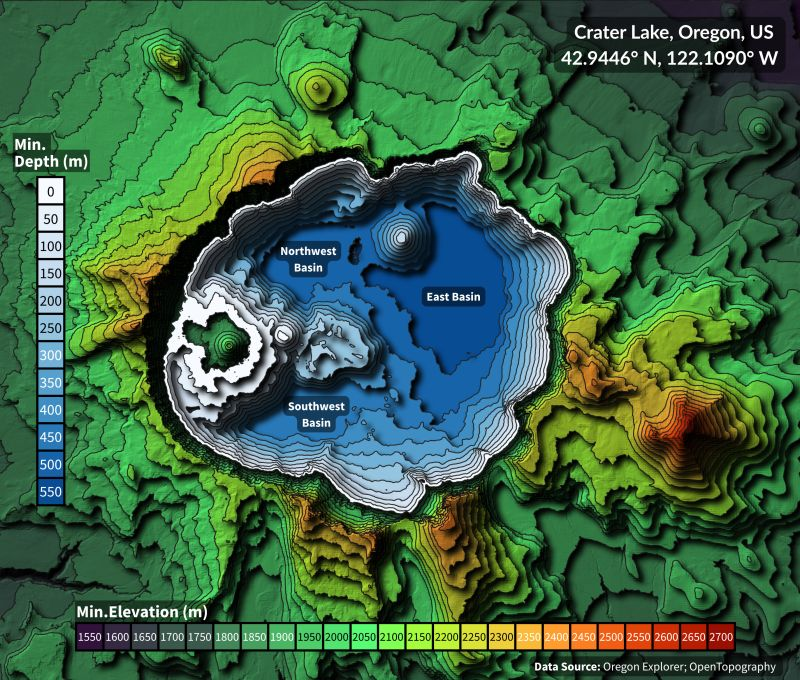
1. James Tan Song En – Crater Lake Bathymetry
My top pick - a technical map combining elevation contours with bathymetric data to create a stunning dual-layer terrain visualisation of the iconic lake.
The range from technical mastery to profound storytelling shows how polygons can shape both data and narratives.
Which polygon map resonated most with you from Day 3?


Comments ()