
#30DayMapChallenge: Urban
The top Urban maps from Day 8, featuring city footprints, building ages, and environmental risk.

Saturday's maps revealed the many layers of city life - from nighttime footprints to medieval architecture. Here are my top 5 picks counting down to number one:
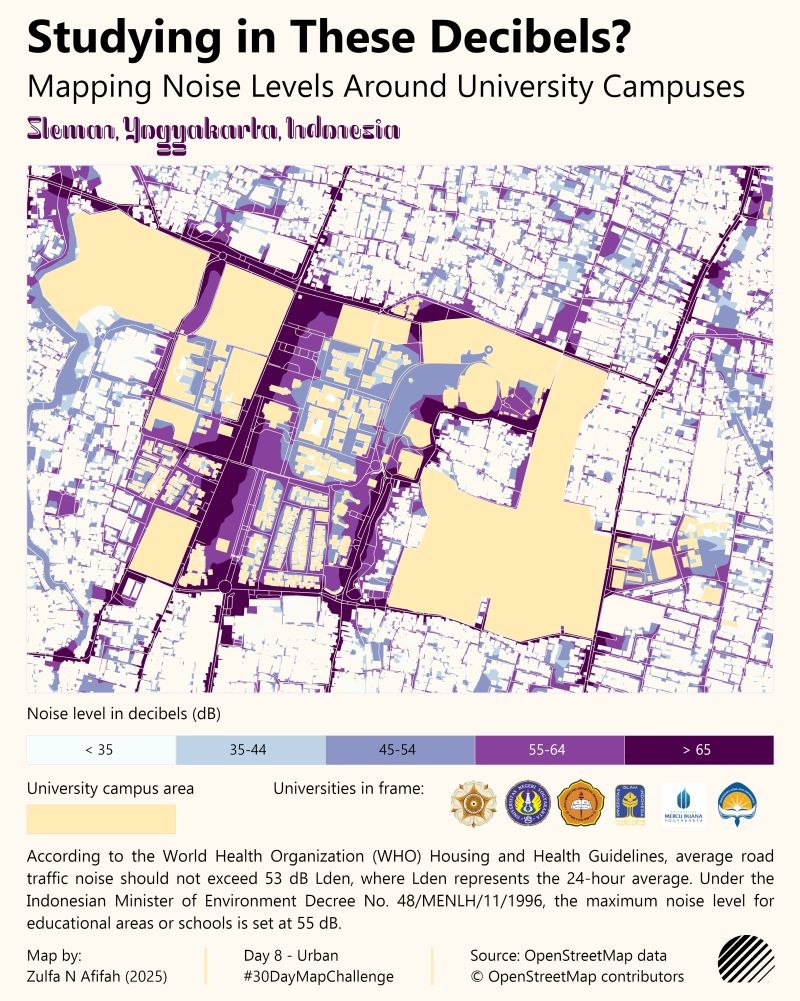
5. Zulfa N 'Afifah – Campus Noise Pollution
An insightful noise map around university campuses in Indonesia, comparing actual decibel levels against WHO safety guidelines for educational areas.
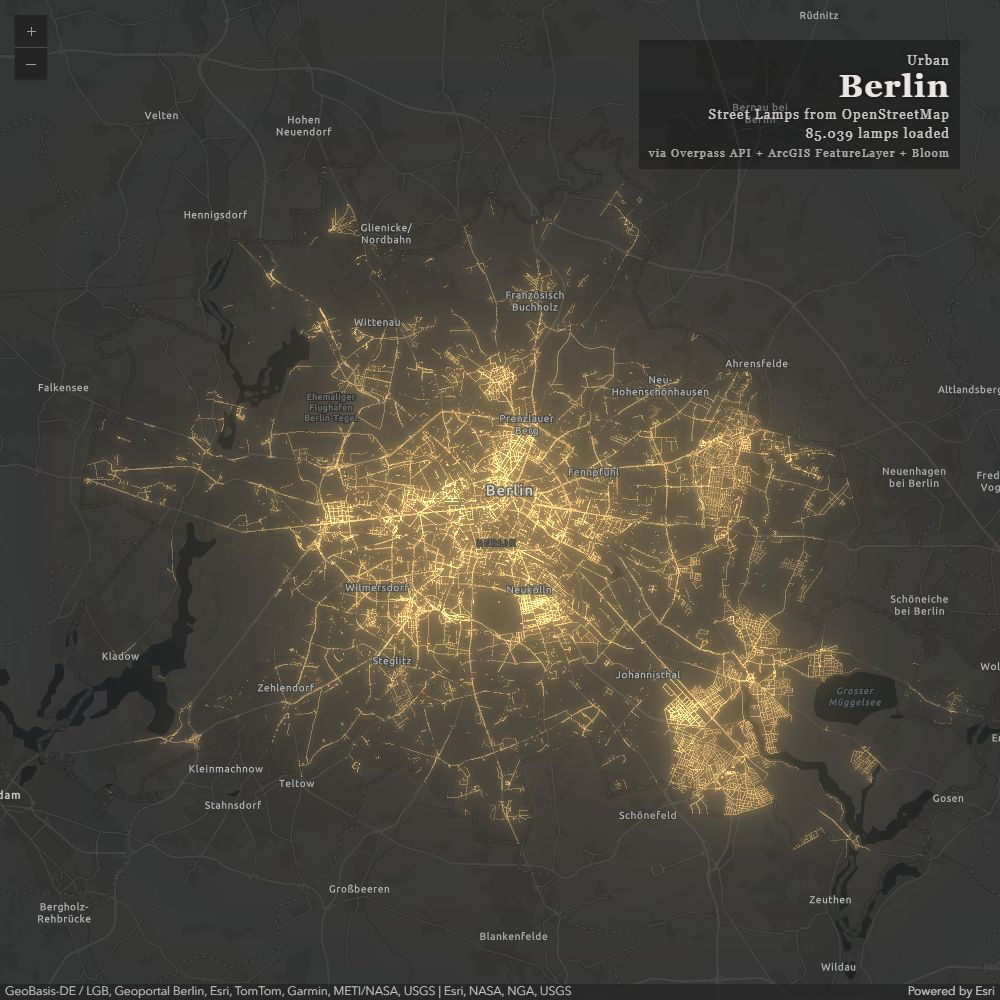
4. Christian Lutz – Berlin Nighttime Footprint
A creative visualisation using OpenStreetMap street lamps to trace Berlin's nighttime urban footprint and activity patterns.
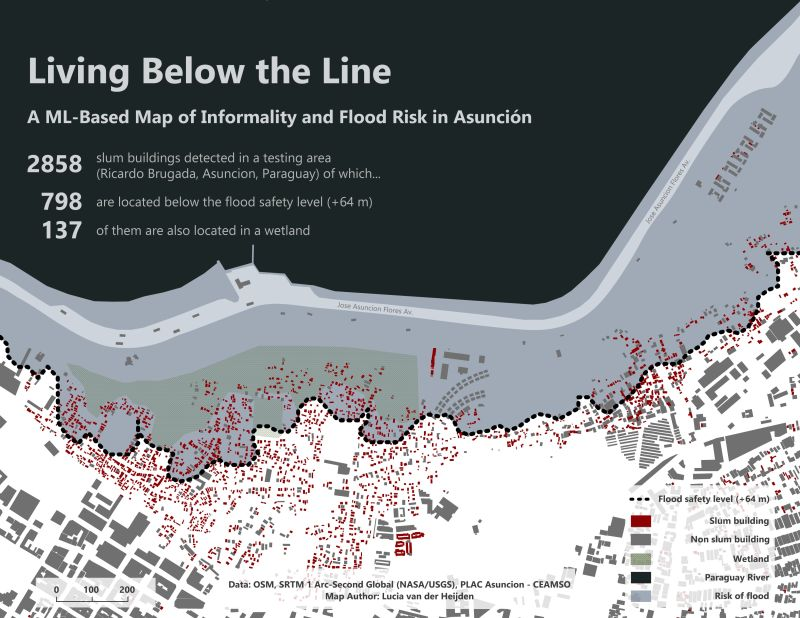
3. Lucia van der Heijden – Informal Settlements & Flood Risk
A powerful ML-based map showing informal settlements in Asunción, Paraguay, where 708 families live below flood safety levels.
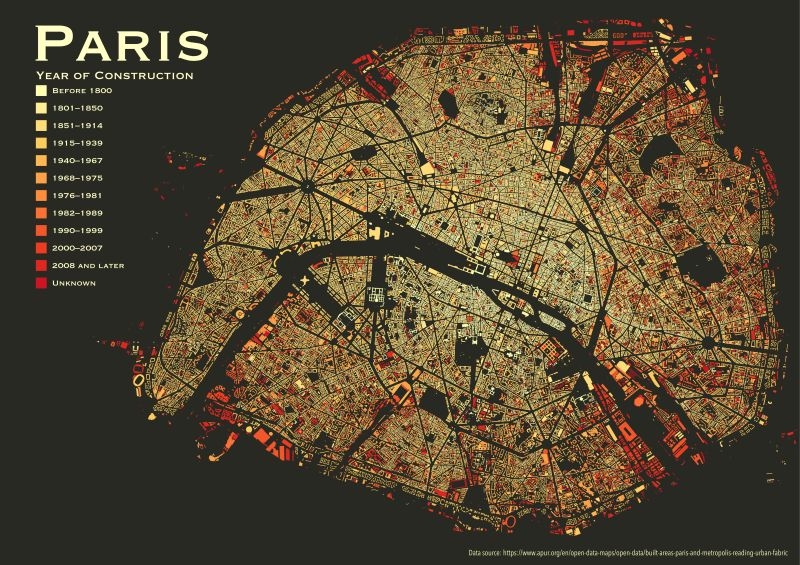
2. Rachel Franklin – Paris Building Ages
A beautiful historical timeline of Paris showing construction eras, revealing how the city has evolved through centuries.
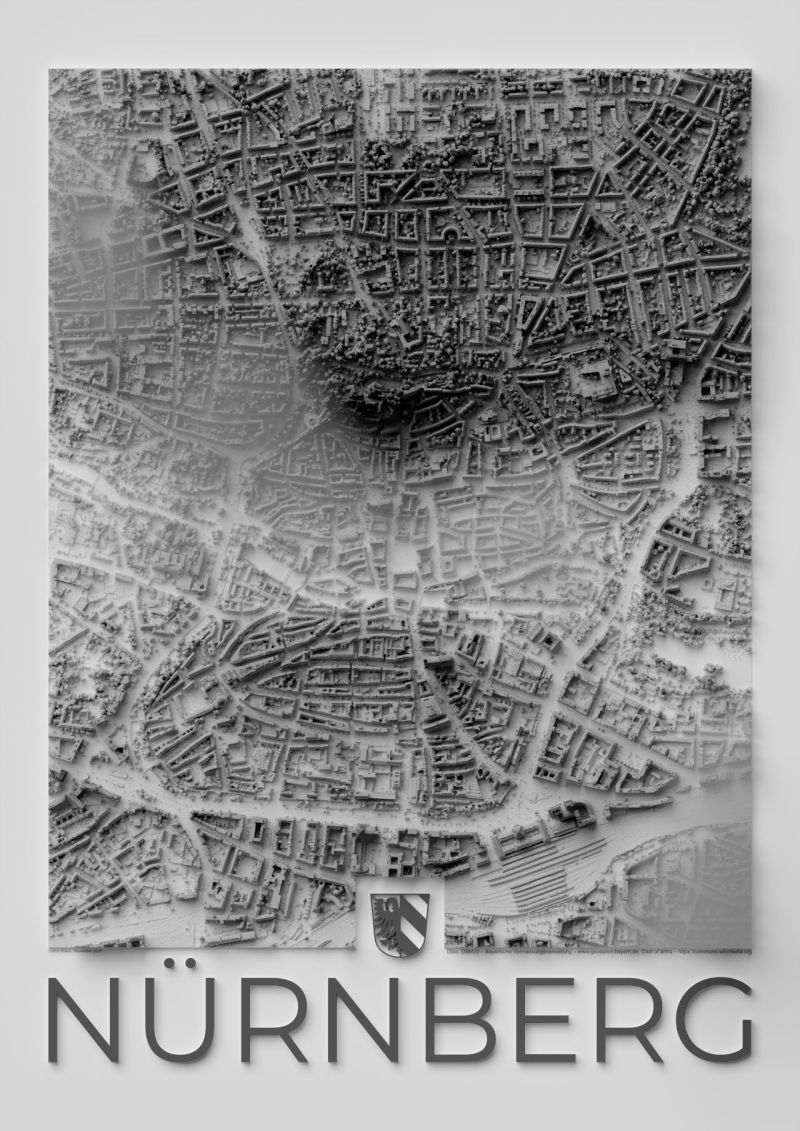
1. Simon Kraus – Nuremberg
My top pick - a stunning technical achievement creating a pseudo-3D map of Nuremberg's medieval old town using digital surface models across QGIS, Affinity, and Blender.
These maps show that urban spaces aren't just buildings - they're stories of risk, history, sound, and light!
Which urban map revealed something new about city life for you?


Comments ()